A flaky task passes on one run and fails on the next with no change to its inputs. Flaky e2e tests are the most common case, but any task can flake. For example, builds that reach for the network. A flaky task blocks a green pull request. The usual response is to hit rerun, which is slow and manual.
Nx Cloud detects flaky tasks and reruns them on a different agent automatically, so most of the time you never see the failure.
How Nx detects flaky tasks
Section titled “How Nx detects flaky tasks”Nx uses its cache mechanism for detection.
- Nx creates a hash of all the inputs for a task whenever it is run.
- If Nx ever encounters a task that fails with a particular set of inputs and then succeeds with those same inputs, it marks that task as flaky.
The hash pins the inputs, so a failure after a code change is not mistaken for a flake, and results from different machines and CI runs count as the same evidence. Detection works at the task level. A task can run a single Playwright spec file, a Jest project, or a whole suite, so the flag names the nondeterministic task, not an individual test inside it.
Nx can't know with certainty when the task has been fixed to no longer be flaky, so if a particular task has no flakiness incidents for 2 weeks, the flaky flag is removed for that task.
Enable flaky task detection
Section titled “Enable flaky task detection”Flaky Task Detection is enabled by default if your workspace is connected to Nx Cloud and leverages Workers.
To connect your workspace to Nx Cloud run:
npx nx@latest connectConnect from your browserSign in to Nx Cloud and connect your repository without the CLI
For the full pipeline walkthrough, see Setting Up CI.
Automatically re-run flaky tasks
Section titled “Automatically re-run flaky tasks”When a flaky task fails in CI with distributed task execution enabled, Nx will automatically send that task to a different agent and run it again (up to 2 tries in total). It's important to run the task on a different agent to ensure that the agent itself or the other tasks that were run on that agent are not the reason for the flakiness.
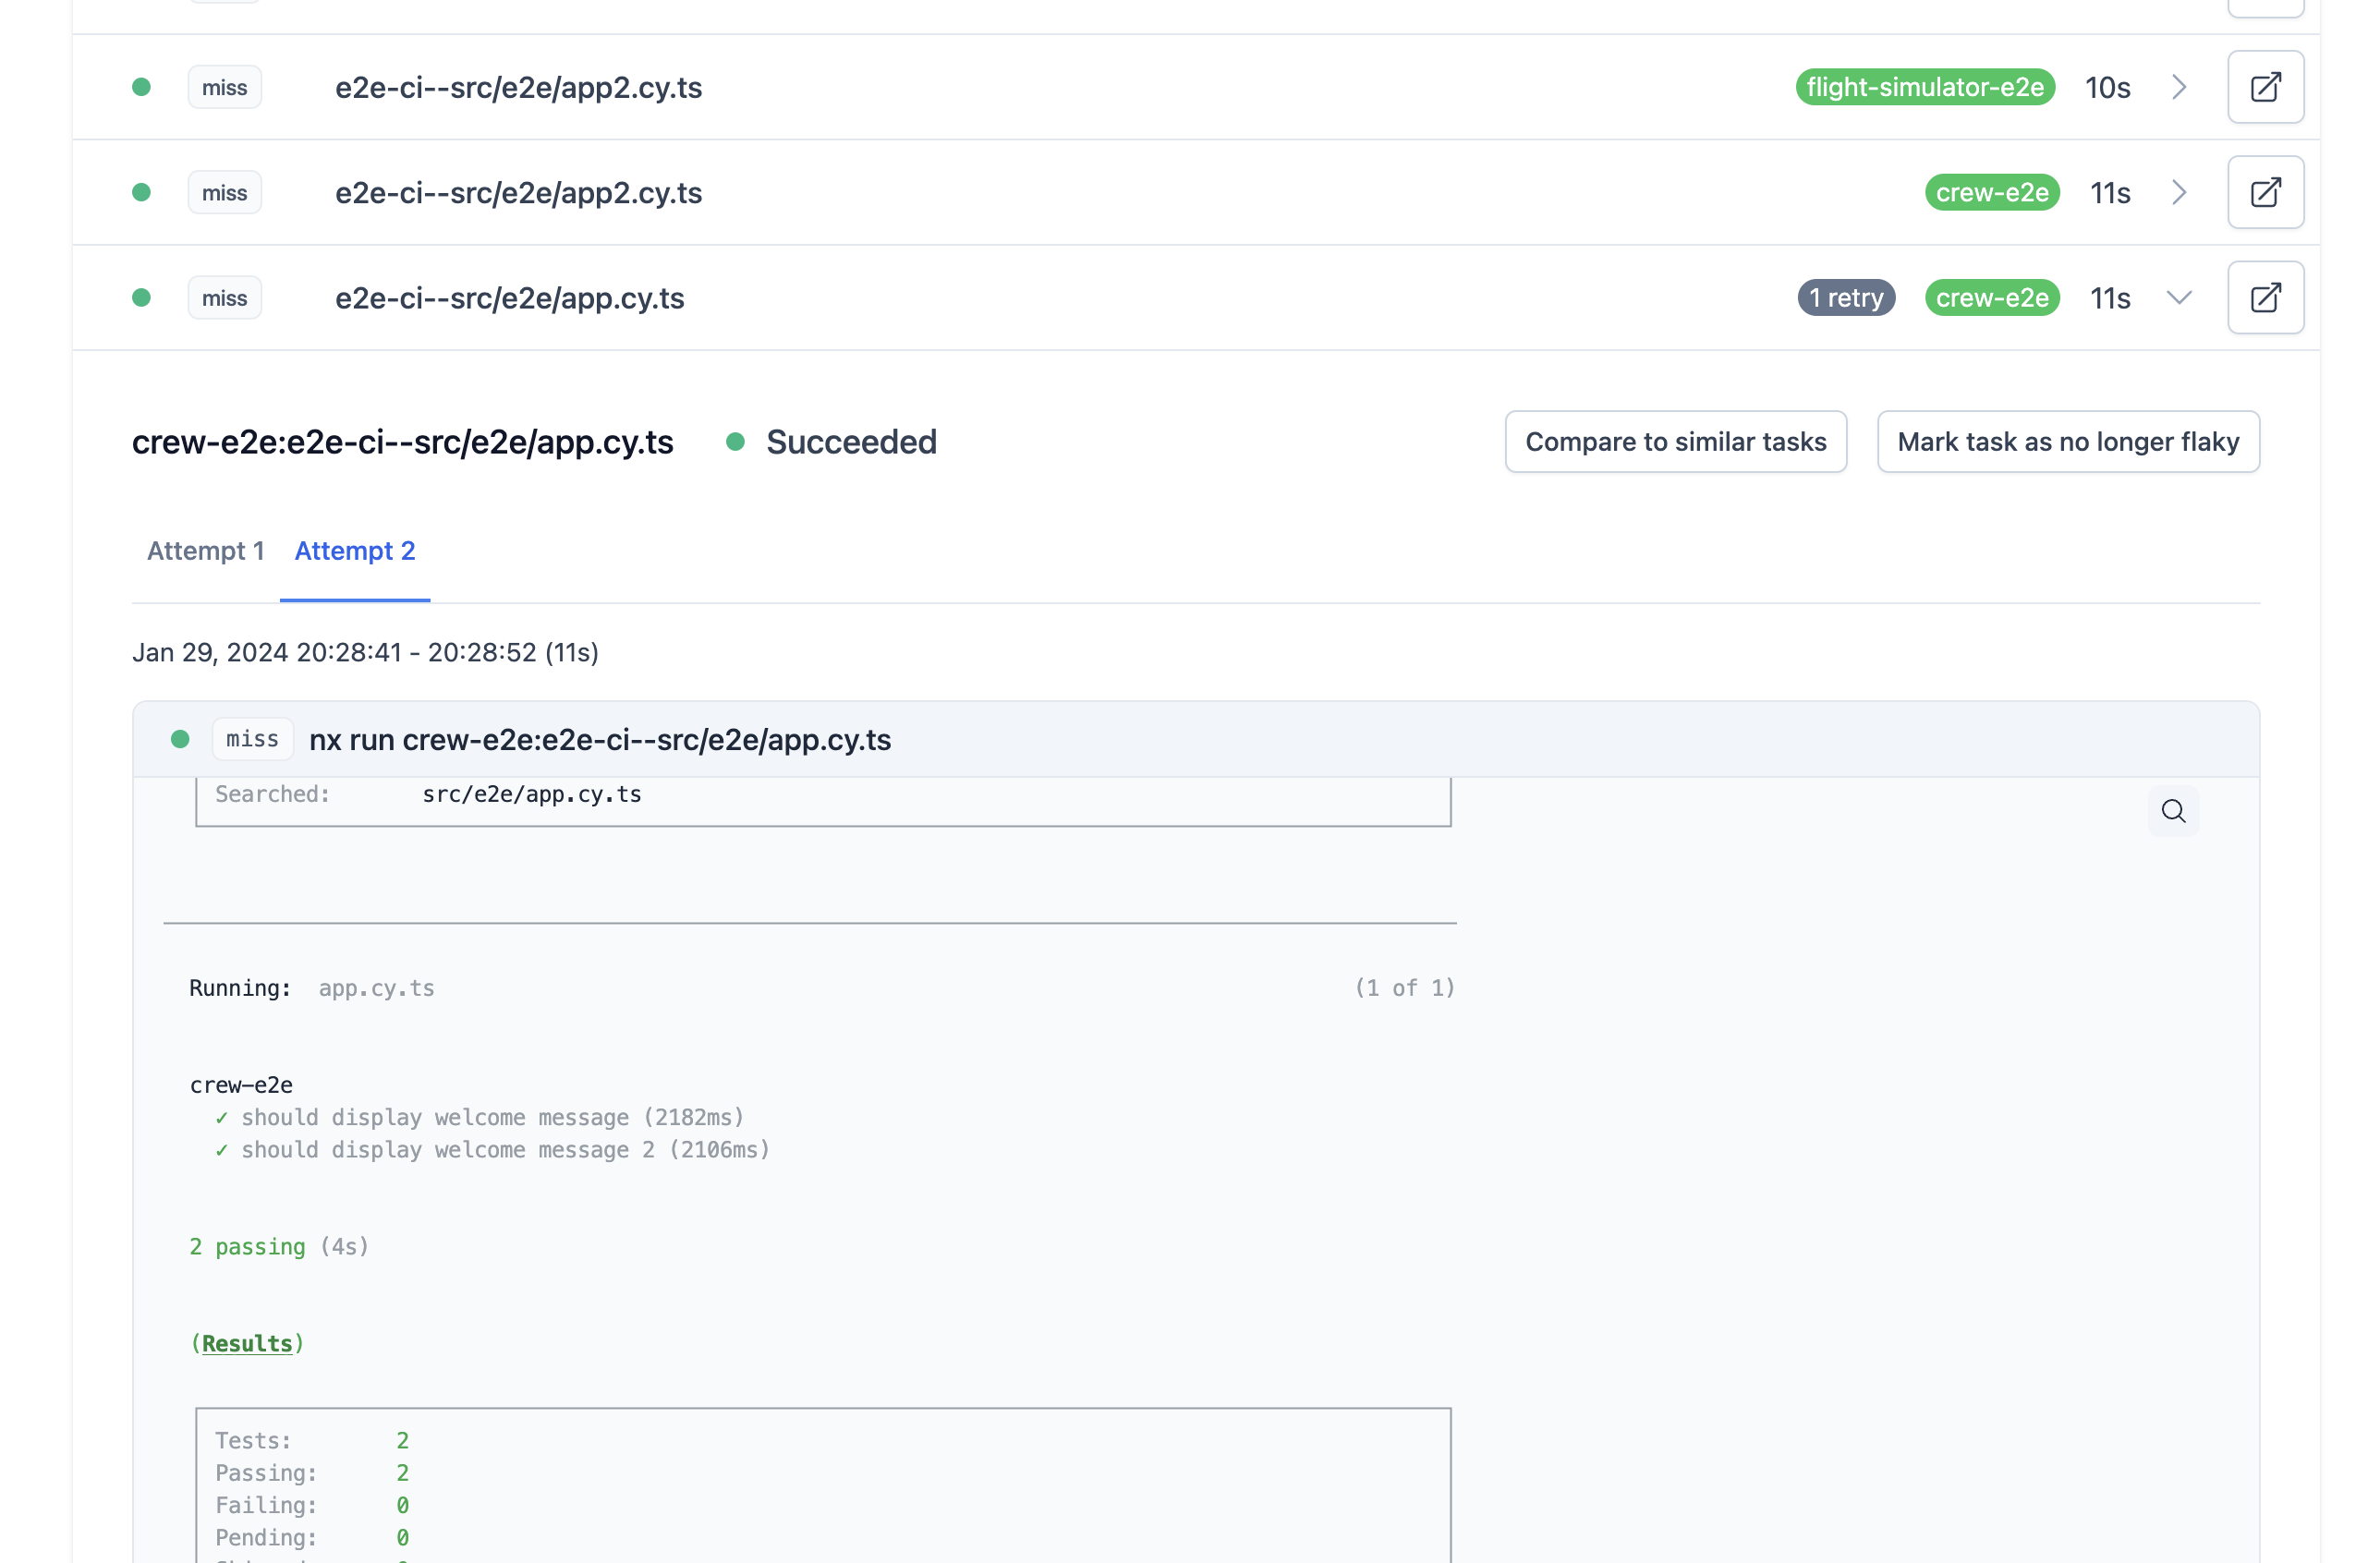
In this image, the e2e-ci--src/e2e/app.cy.ts task is a flaky task that has been automatically retried once. There is a 1 retry indicator to show that it has been retried and, once expanded, you can see tabs that contain the logs for Attempt 1 and Attempt 2. Comparing the output of a successful and an unsuccessful run side by side is usually where the cause shows up.
The narrower the task, the cheaper the retry. Automated task splitting turns an e2e suite into one task per test file for @nx/playwright, @nx/cypress, @nx/jest, and @nx/vitest, so a single flaky spec file reruns on its own instead of dragging the whole suite with it.
Flaky task analytics
Section titled “Flaky task analytics”Once a workspace has more flaky tasks than anyone will fix this week, the useful question is which one to fix first. The Nx Cloud dashboard ranks every flaky task in your workspace so you can work down the list instead of guessing.
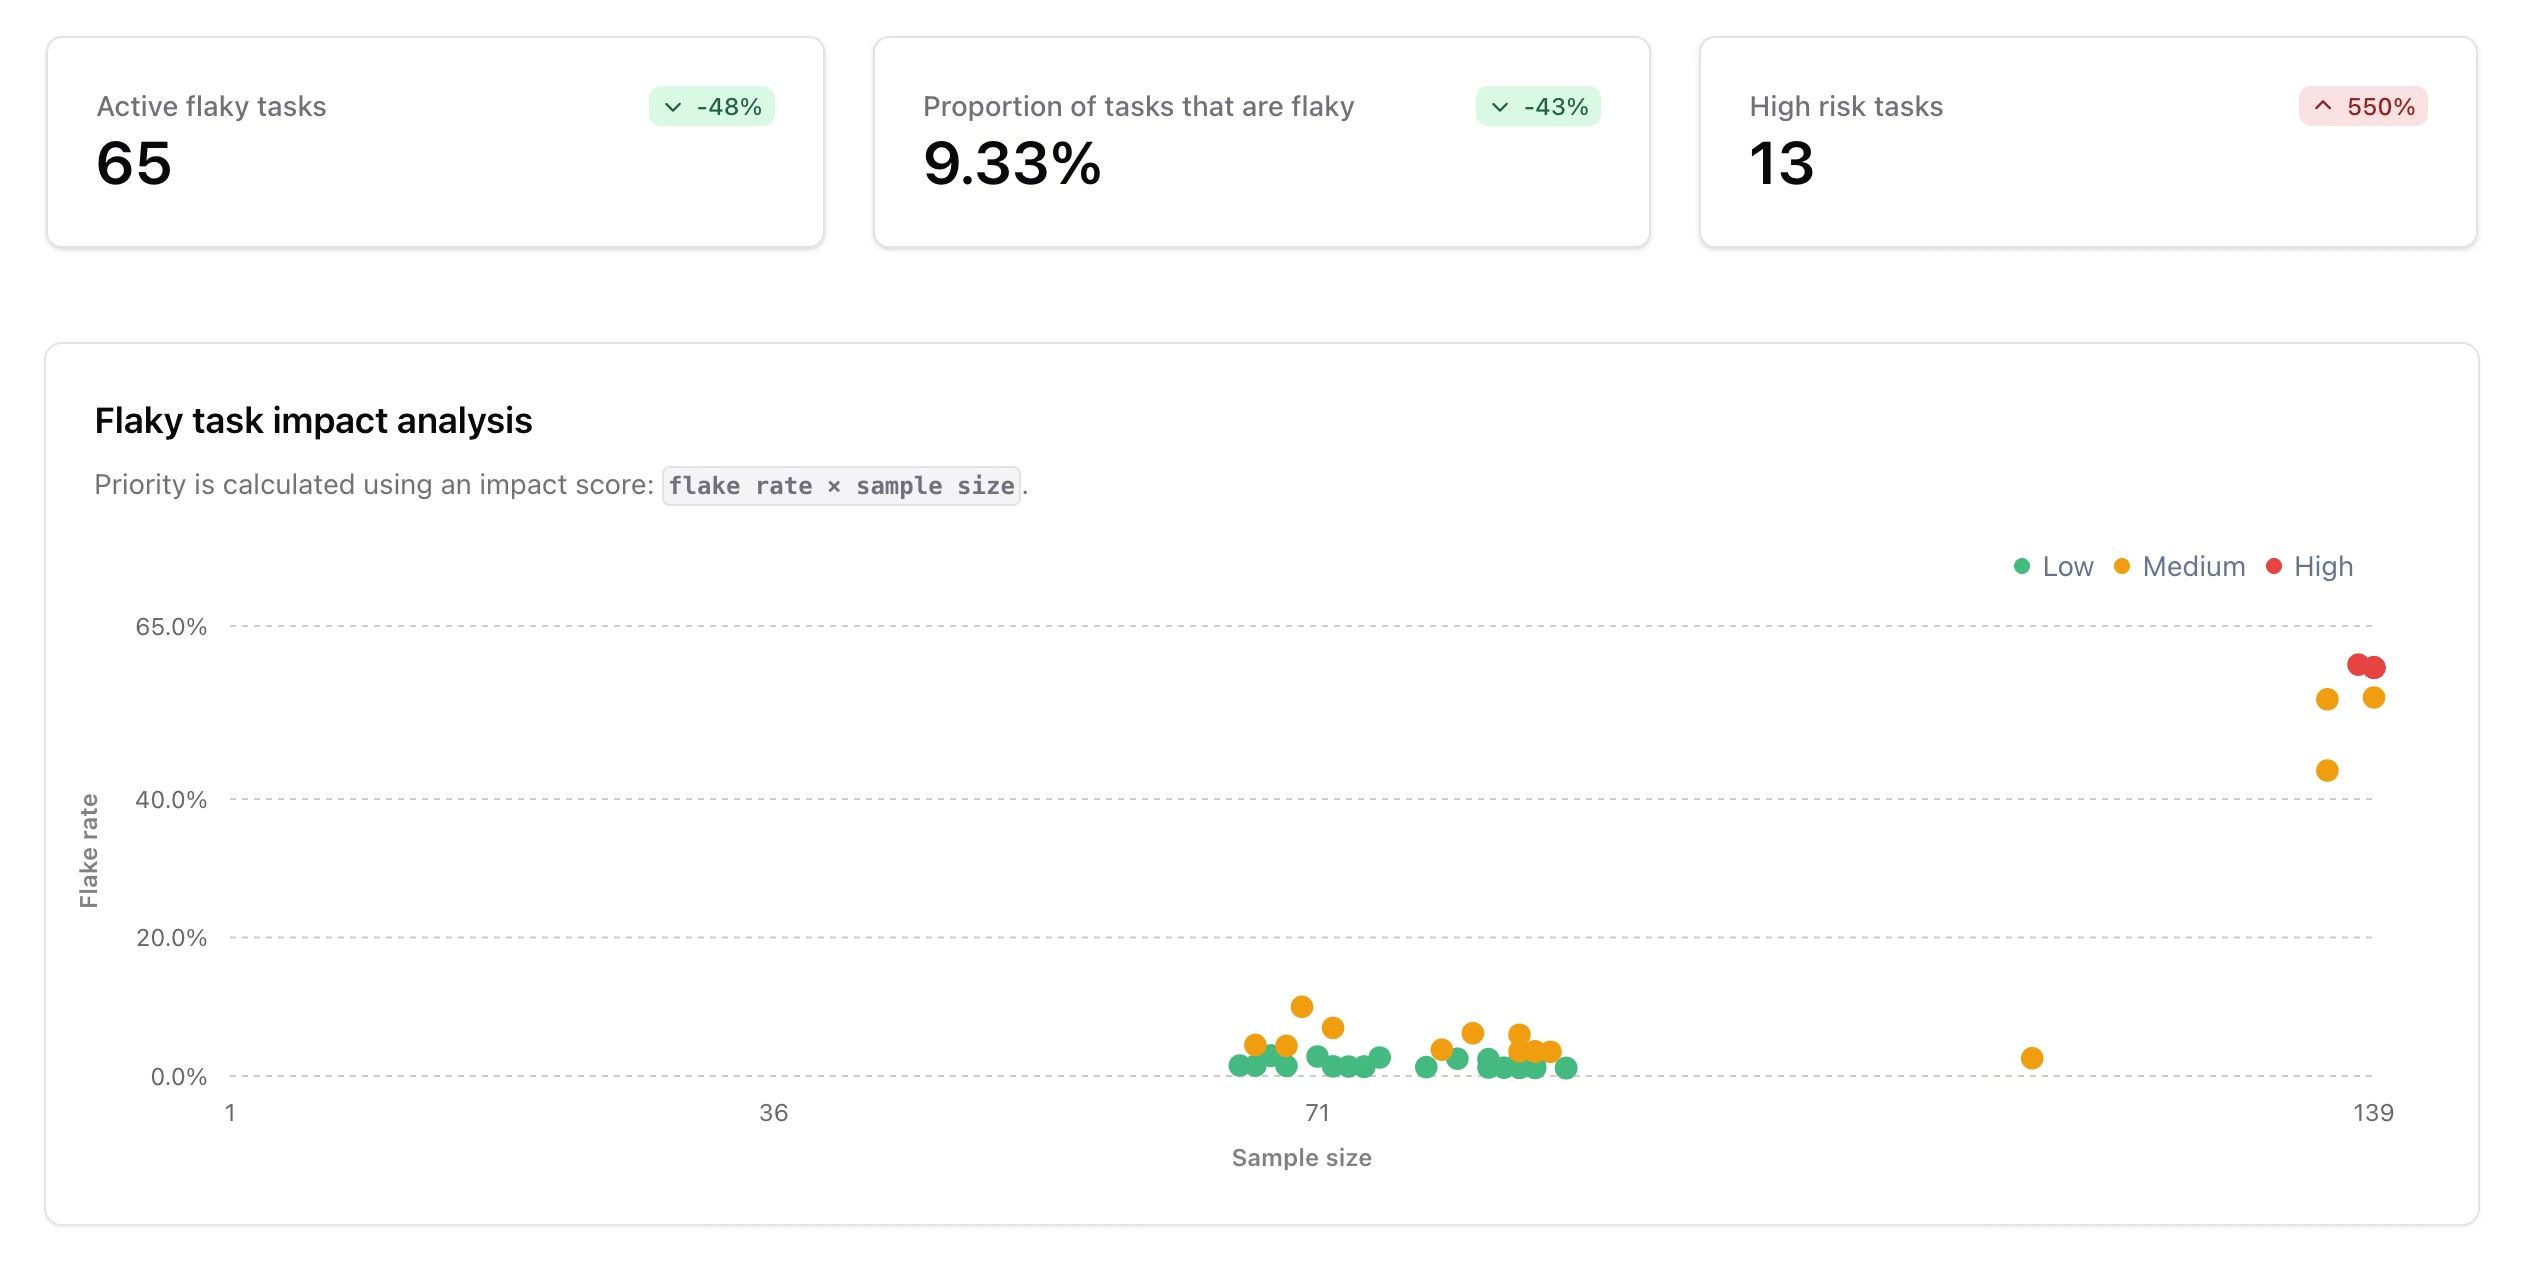
The dashboard displays key metrics over the selected time range (7 days vs 30 days):
- Active flaky tasks - The total number of tasks in your workspace that have a flake rate greater than 0 within the selected time window.
- Average flake rate - A weighted average flake rate across all tasks in your workspace. A task that ran 1000 times with a 5% flake rate has more impact than one that ran 10 times with a 50% flake rate.
- High risk tasks - The number of tasks with a flake rate higher than 20%.
Tasks are plotted by impact score, calculated as flake_rate × sample_size, so frequently-run flaky tasks are weighted higher than rarely-run ones.
Flaky task table
Section titled “Flaky task table” 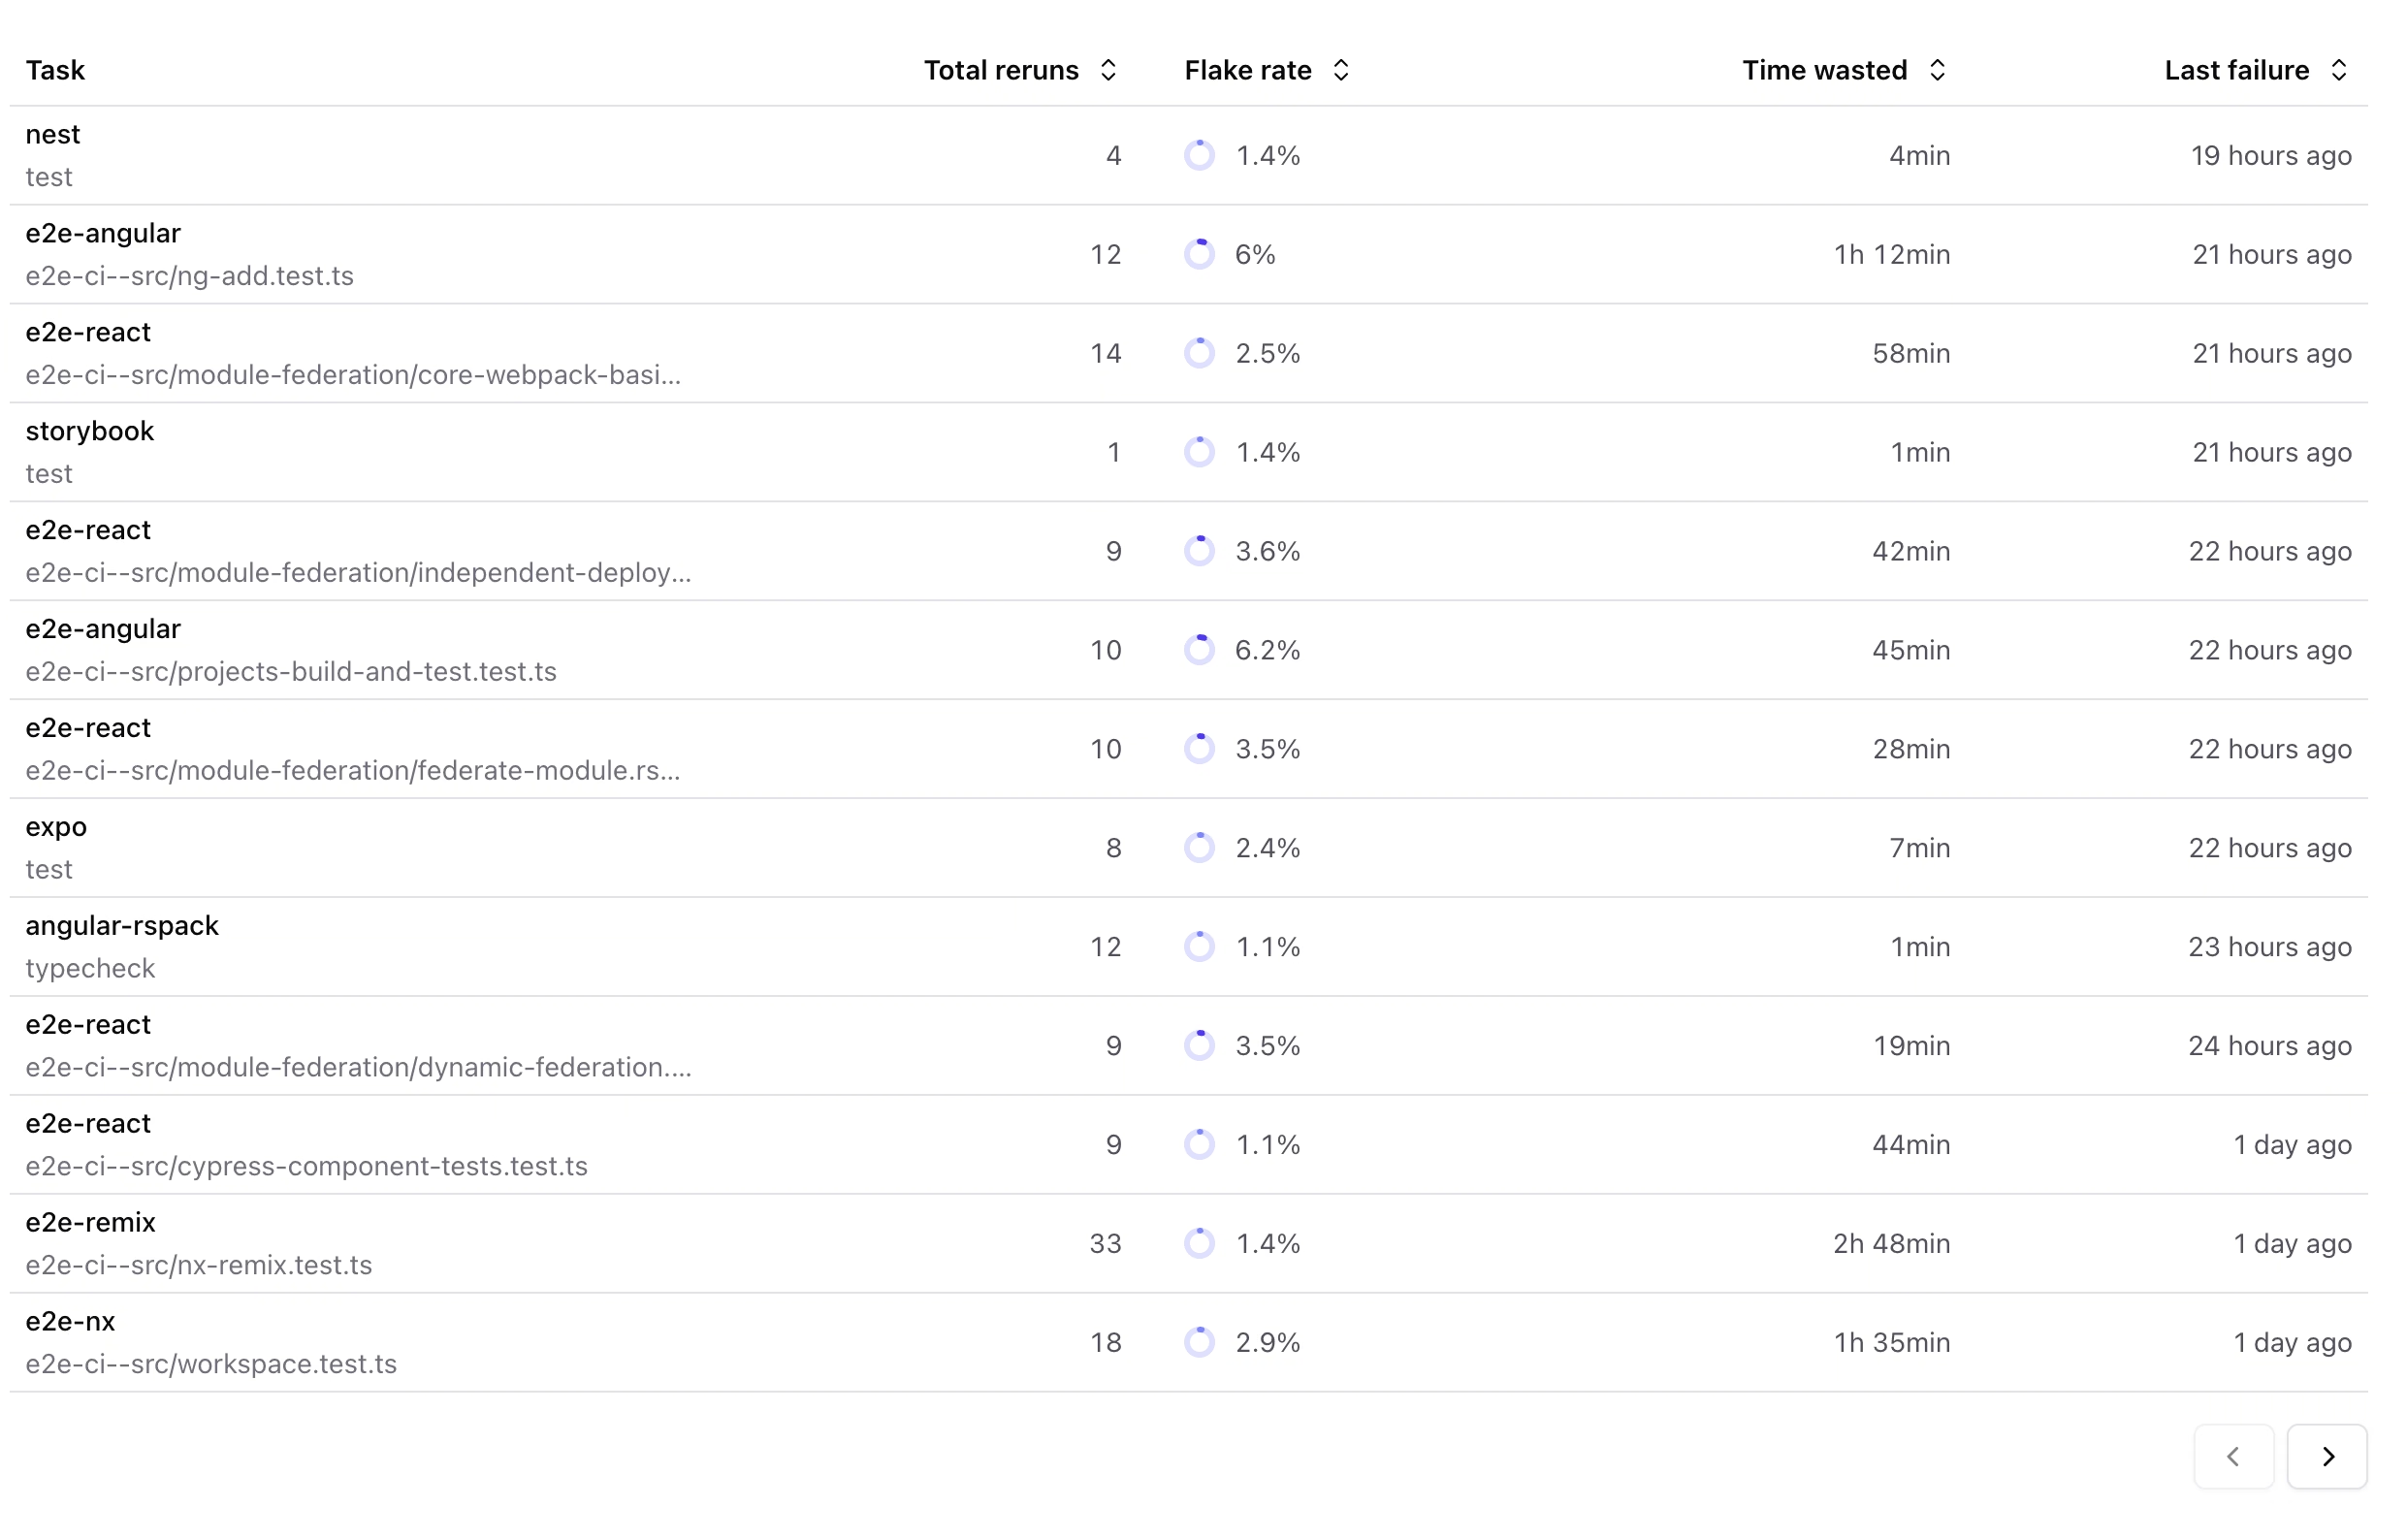
Each row includes:
- Task - The project and target combination (e.g.,
my-app:test) - Flake rate - The percentage of total successes that came from unreliable (flaky) task hashes:
flaky_successes / (flaky_successes + non_flaky_successes) - Total reruns - The number of extra executions caused by flakiness:
total_executions - unique_hash_count - Time wasted - An estimate of the total time spent on reruns: total reruns multiplied by the average task duration
- Last failure - The timestamp of the most recent failure across all contributing task hashes
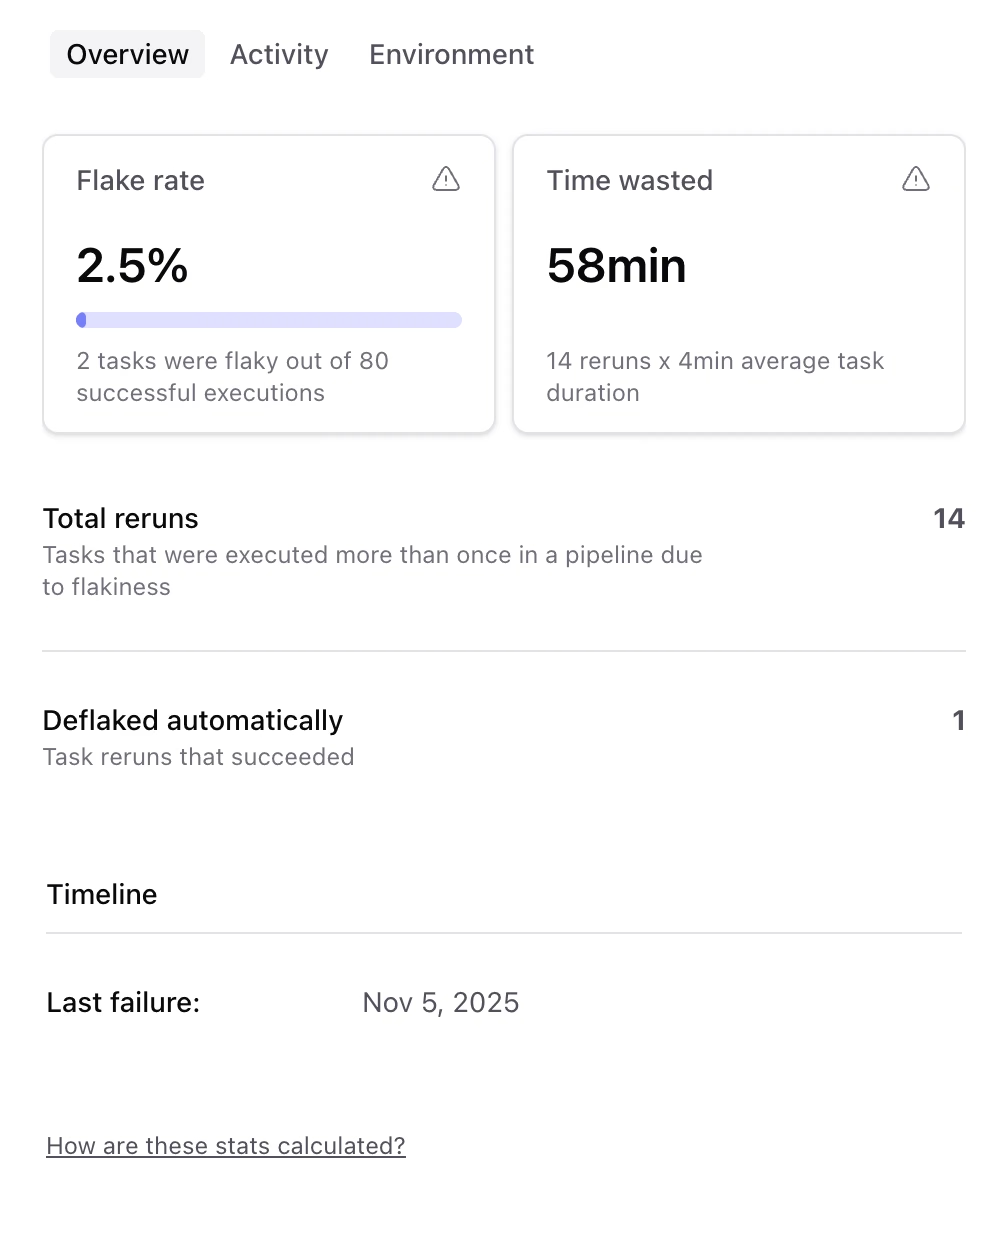
Click a row to open the detail view. The Overview tab shows flake rate, time wasted, and automatic deflake counts for the task, the Activity tab shows a timeline of failed and successful executions to jump into the runs, and the Environments tab shows where the task was executed to help identify whether certain environments contribute to the flakiness.
Comparing a failed attempt against a successful one is usually where the cause shows up. Find and fix flaky tests covers the common causes and how to fix them.