Series: Making your LLM smarter
- Nx Just Made Your LLM Way Smarter
- Making Cursor Smarter with an MCP Server For Nx Monorepos
- Nx MCP Now Available for VS Code Copilot
- Nx and AI: Why They Work so Well Together
- Save Time: Connecting Your Editor, CI and LLMs
- Enhancing Nx Generators with AI: Predictability Meets Intelligence
- Your AI Assistant Can Now Read Your Terminal: Real-Time Development Error Fixing
- Introducing Self-Healing CI for Nx and Nx Cloud
- Analyze Your Nx Cloud Runs With Your AI Assistant
- Automatically Fix your CI Failures with JetBrains AI Assistant
As a technical leader or CTO, your primary goal is enabling your teams to work faster and work better. This requires a holistic view of your workspace, from architecture optimization to optimizing how fast developers ship.
Your CI data is a vastly underutilized optimization resource. Nx Cloud registers actionable insights like which projects are affected most often, which tasks fail consistently, and detailed logs about the tasks that fail. But this wealth of data is overwhelming to analyze manually, even with charts and dashboards.
What if you could pull this data directly into AI conversations and analyze it contextually? "Show me all failed builds from the last 28 days and identify the most common failure patterns." "Which tests are consistently flaky and costing us the most time?" "How do our cache hit rates compare between PR branches and main?"
This is exactly what we enabled by integrating Nx Cloud APIs into our Nx MCP: conversational data analysis that transforms how technical teams understand and optimize their CI pipelines.
From dashboards to AI conversations: A new paradigm?
The way we interact with software is undergoing a fundamental shift. Instead of navigating complex dashboards and correlating data across multiple charts, we're moving toward conversational interfaces where AI assistants help us extract insights through natural language.
This transformation is particularly valuable for technical leadership, where the most important questions often emerge from context—during board meetings, architecture reviews, incident post-mortems, or quarterly planning sessions. Traditional dashboards show you what happened, but conversational AI helps you understand why it happened and what to do about it:
- Ask contextual questions like "Why did our build times spike after last week's deployment?"
- Get personalized reports that focus on your specific optimization goals
- Uncover hidden patterns that static dashboards might miss
- Generate actionable insights tailored to your current business priorities
The emergence of Model Context Protocol (MCP) has accelerated this shift by enabling AI assistants to connect directly to live data sources, transforming how we analyze and act on operational data.
Enable your AI assistant to connect to Nx Cloud data
Every CI run in your Nx Cloud workspace generates rich operational data that's perfect for conversational analysis. Through our new MCP integration, your AI assistant now has direct access to:
- Pipeline execution history: Complete run details with branch context, commit authors, success/failure status, and execution timelines
- Task-level performance metrics: Individual task analytics including success rates, cache hit patterns (both remote and local), and execution durations
- Caching intelligence: Deep insights into cache miss patterns, effectiveness by task type, and time-based performance trends
- Command execution analysis: Detailed breakdown of commands run, task distribution, and parallel execution patterns
- Team collaboration insights: Active branch analysis, contributor patterns, and merge frequency data
- Historical trend analysis: Time-series data for identifying optimization opportunities and capacity planning
While the Nx Cloud analytics dashboard provides excellent visualizations of time saved, cache performance, and basic trends, the real breakthrough happens when you can have a conversation with this data. Instead of interpreting charts, you can ask direct questions that emerge during your team's planning and review sessions, getting immediate, context-aware answers that drive actionable decisions.
Example: Searching for CI pipeline optimization opportunities
Consider watching the video attached to this article for a walkthrough of some potential examples that I ran on the Nx GitHub repository's Nx Cloud workspace. Note, this is just an example to give you an idea and inspire you to try your own "queries".
My goal here was to look at the last 28 days of CI runs and identify tasks that fail often and are therefore inhibiting the performance and effectiveness of my team.
I started by first grabbing all CI pipeline executions into my conversation. You can think of them as a grouping of tasks that happened in a single continuous CI pipeline.
Use Nx Cloud and extract me all the CI pipeline executions of the last 28 days.
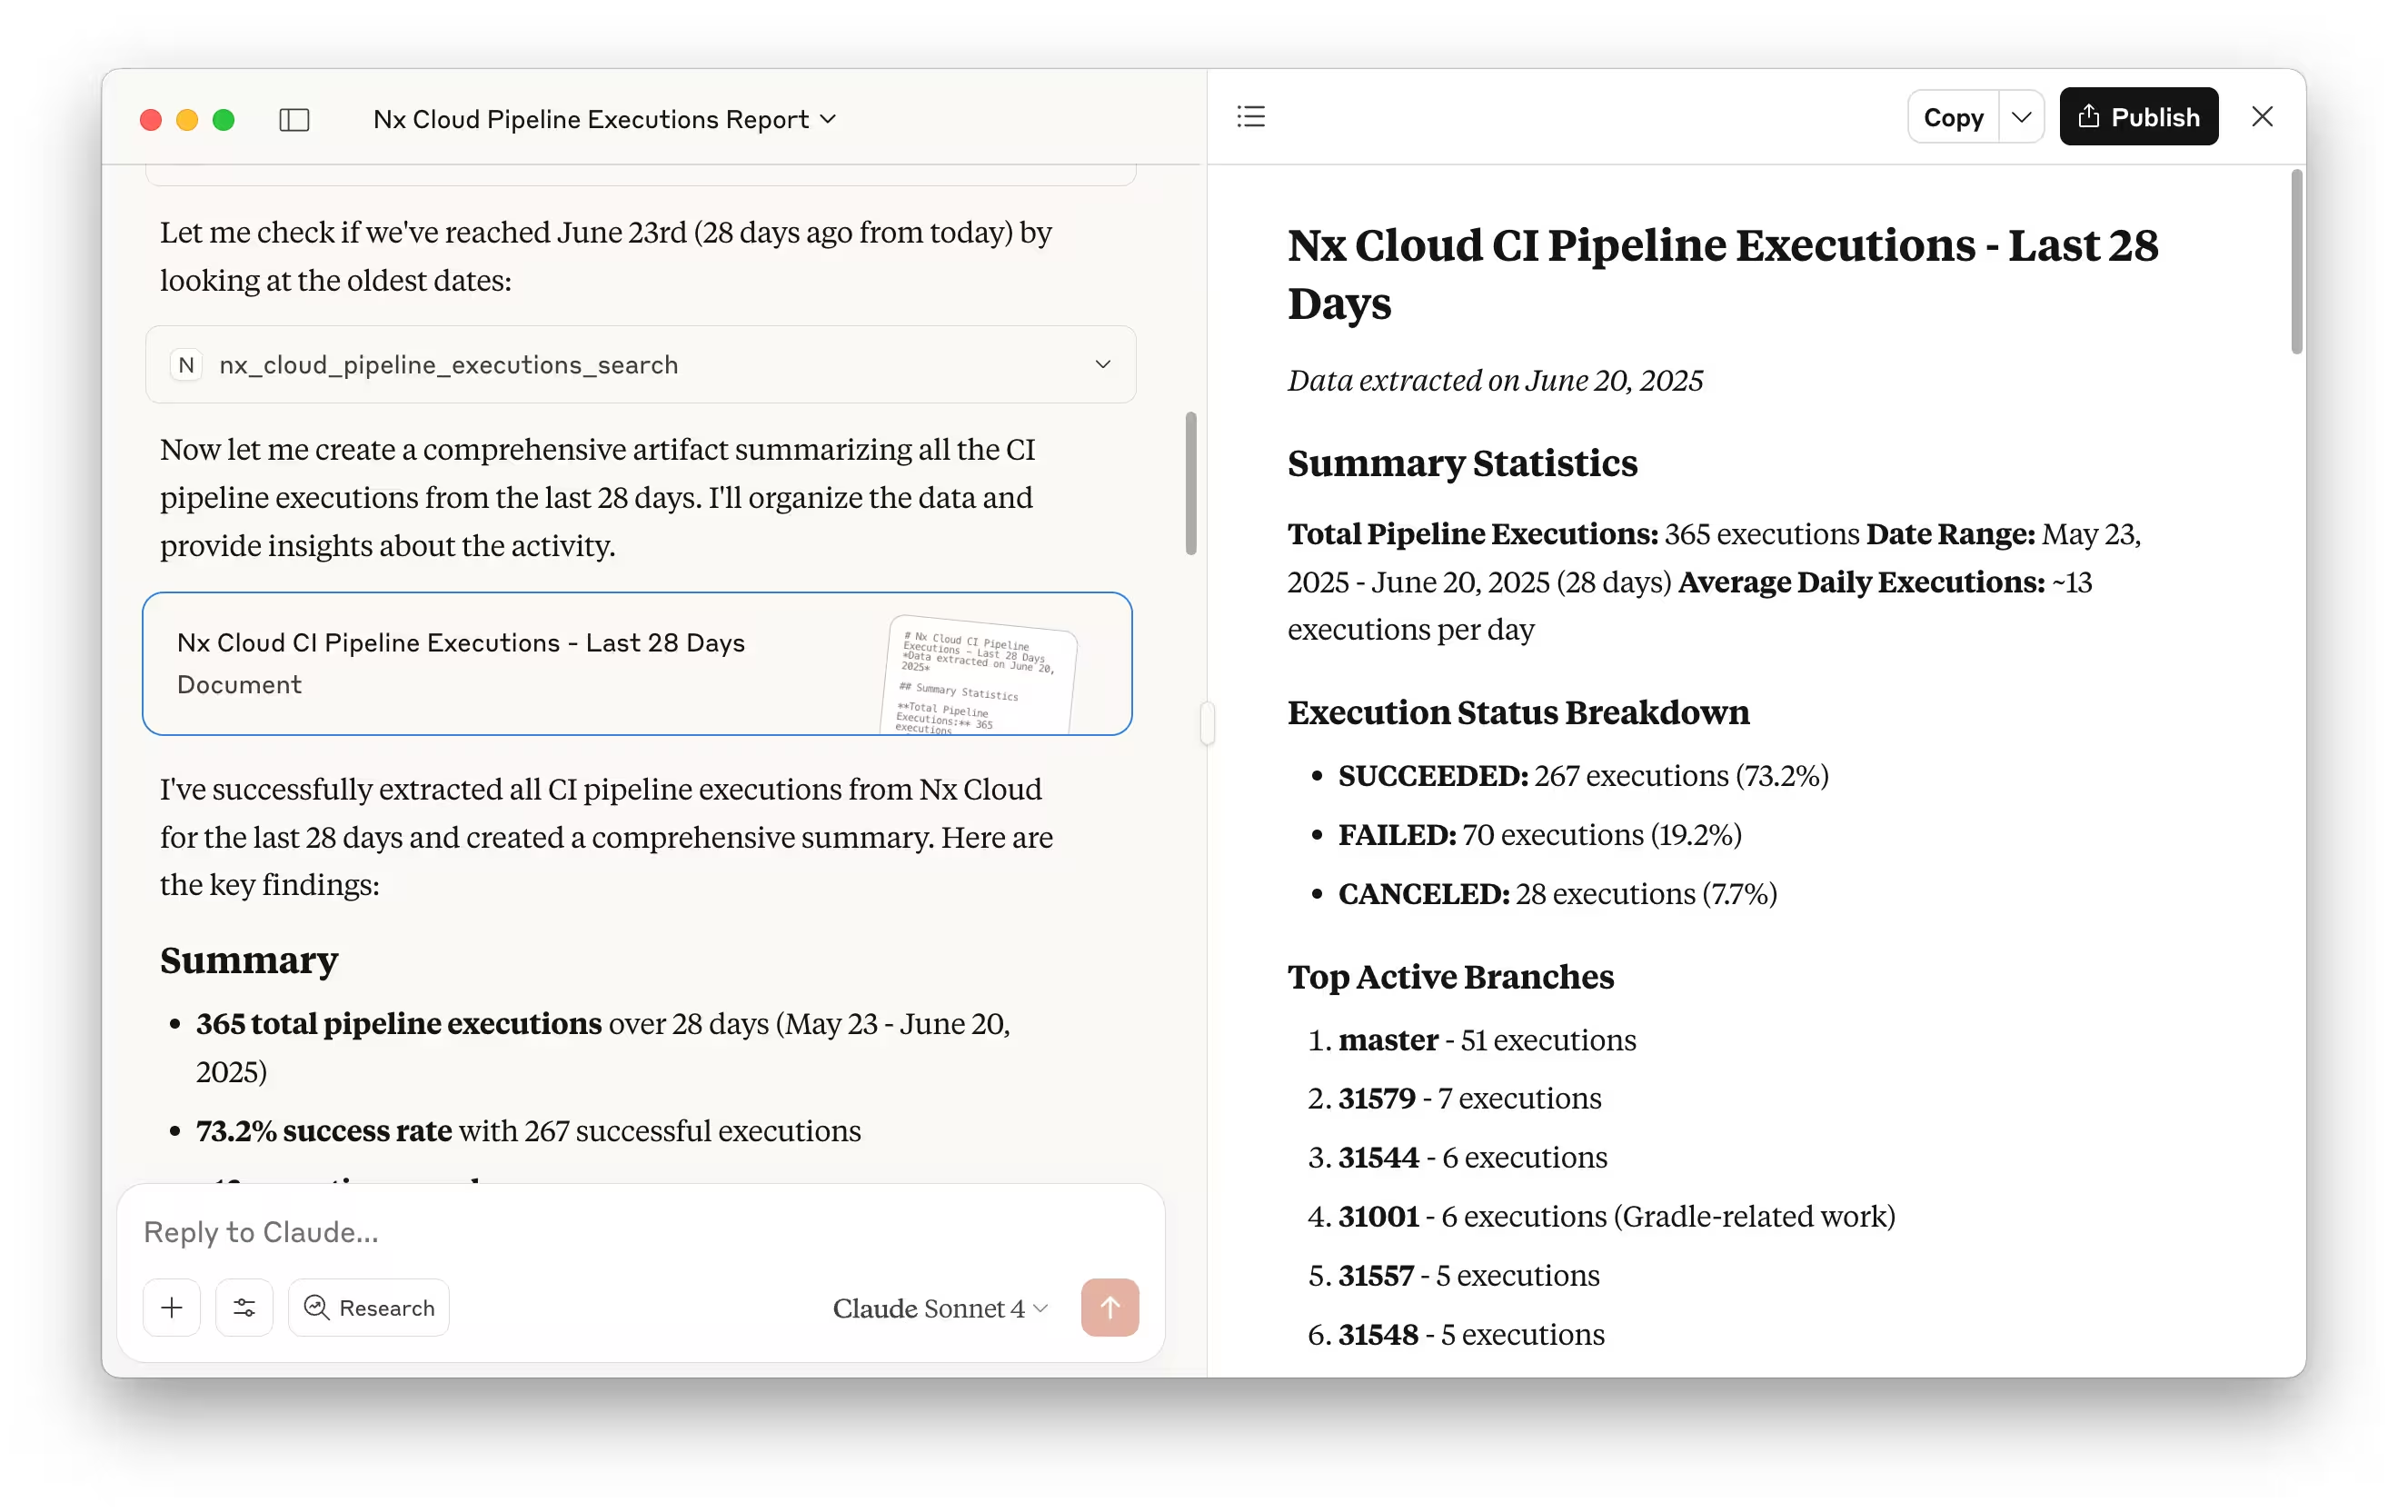
The AI immediately provides a report showing the distribution of successful vs failed pipeline executions, active branches, and contributor activity patterns.
Next, I wanted to dig deeper into the actual failure patterns:
Can you extract all the runs from these pipeline executions? And I'm mostly interested in the failed ones. I'd like to better understand whether there are some patterns of why certain tasks fail.
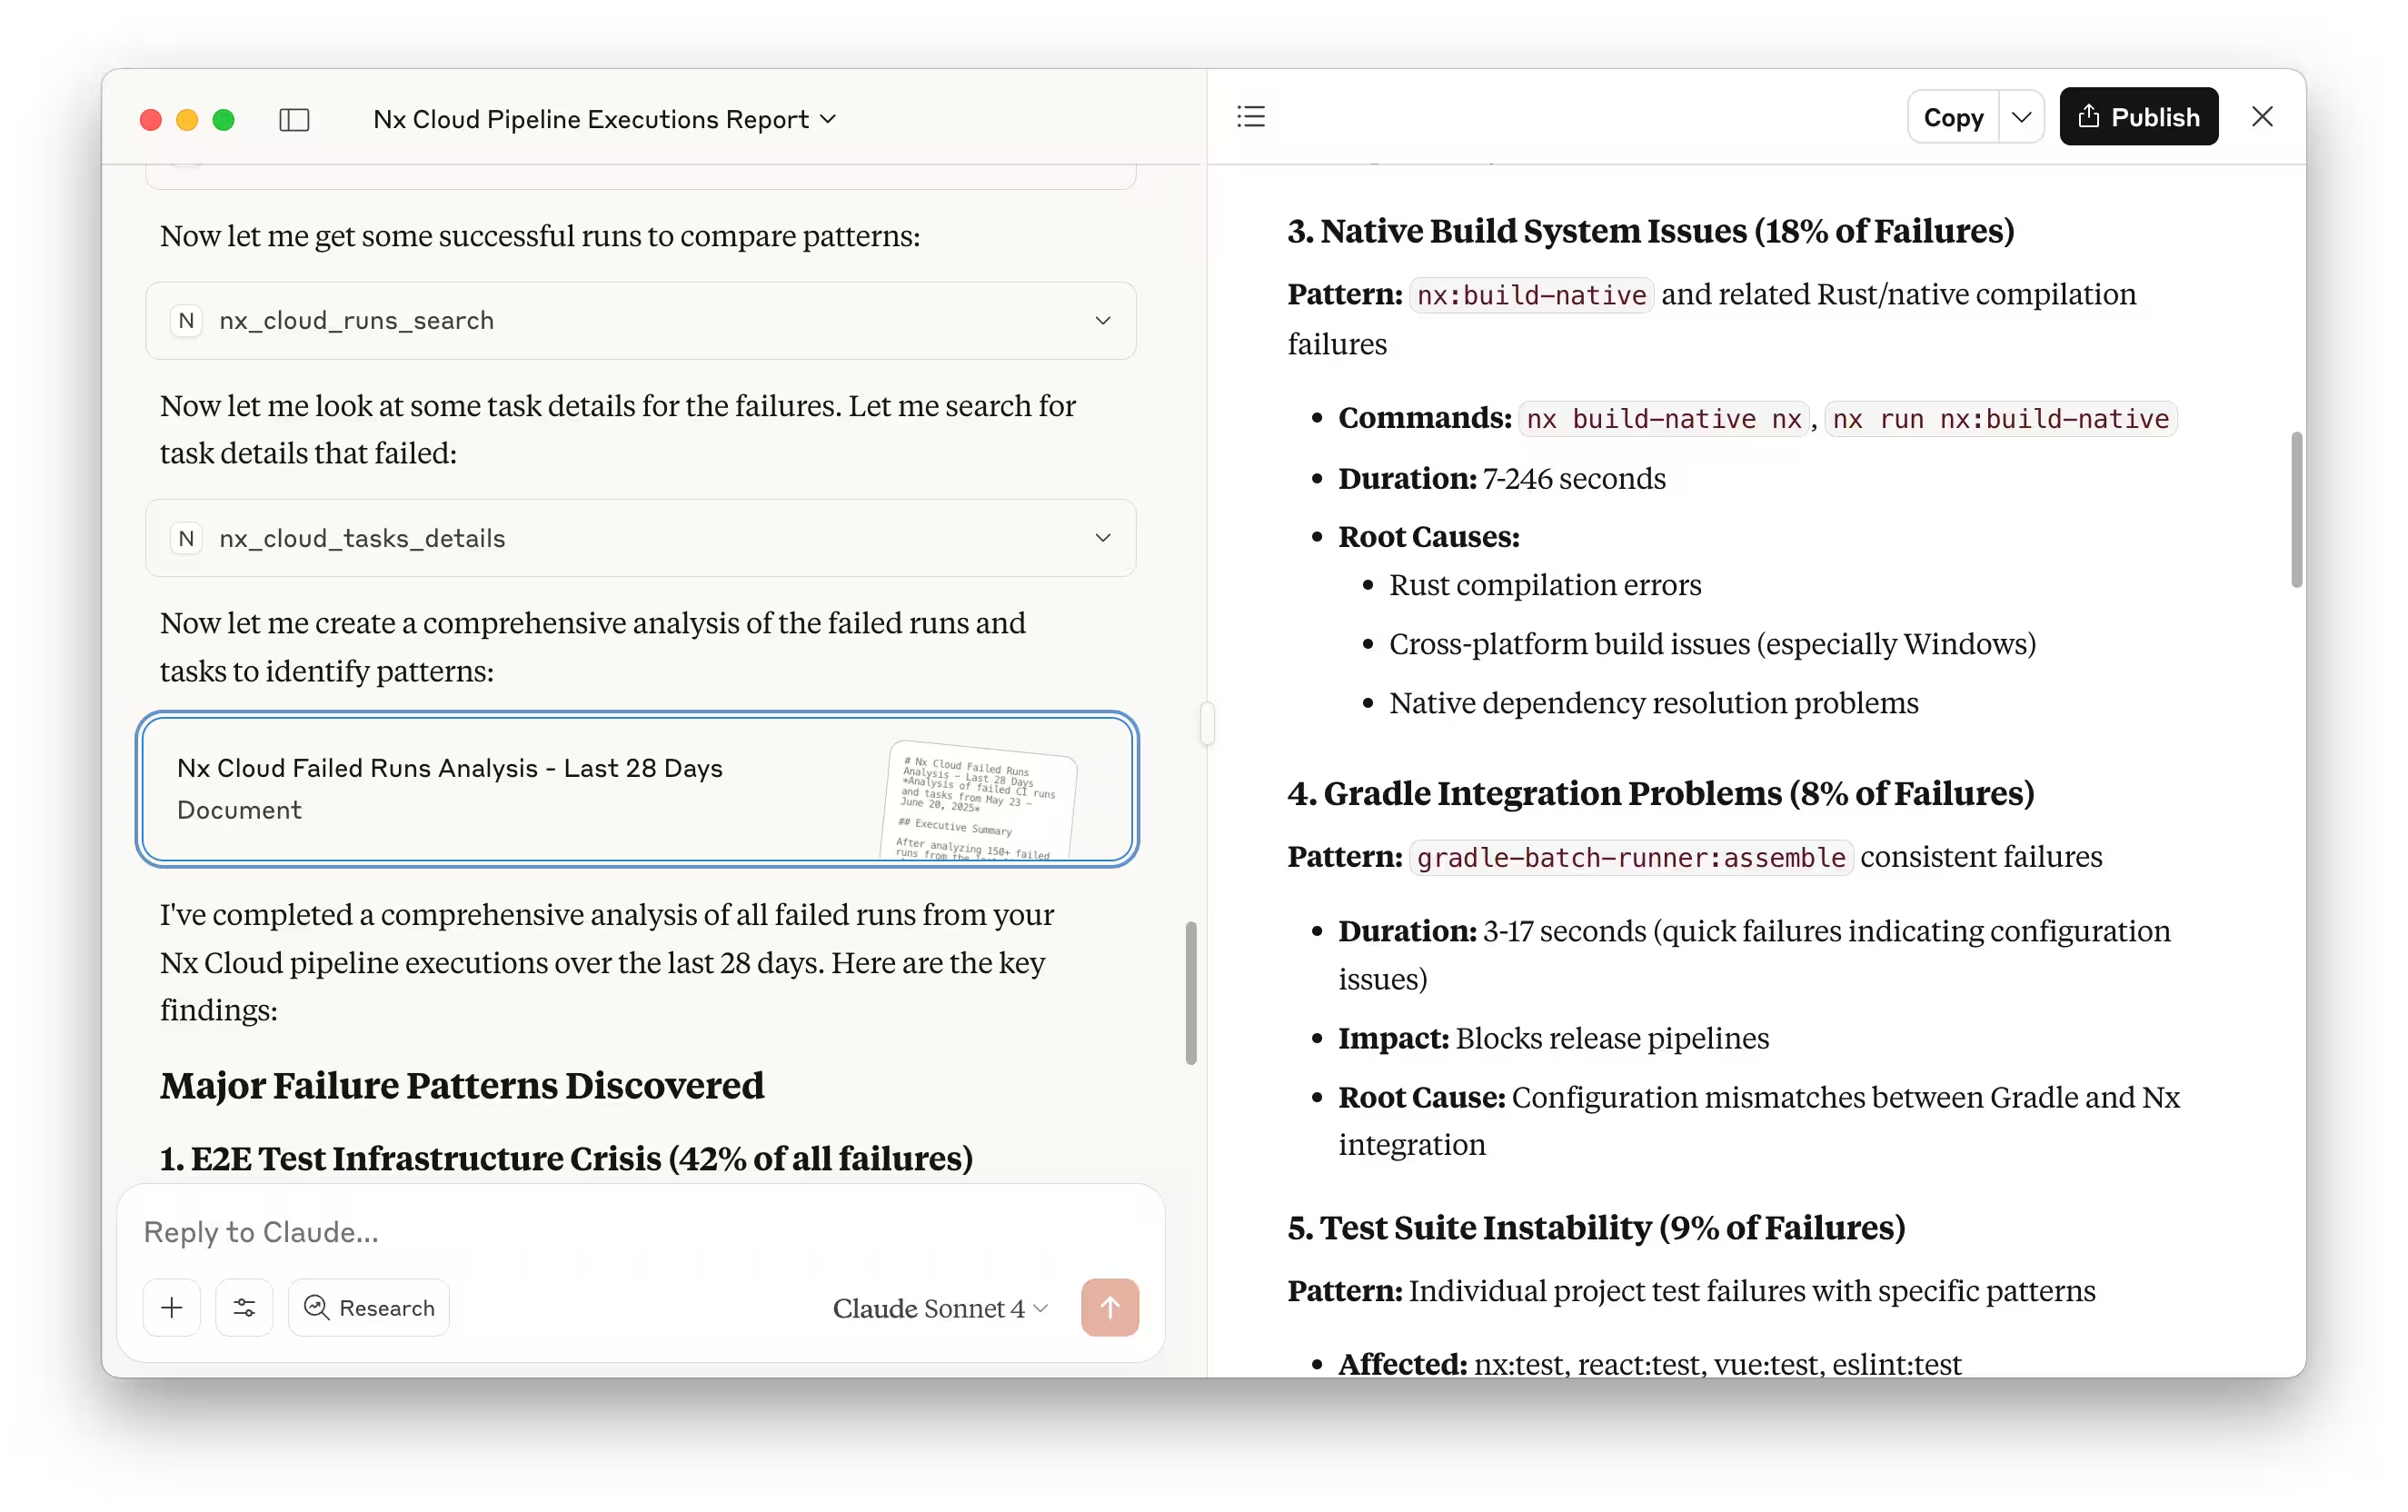
This revealed that there are apparently a lot of native (Rust) build-related failures. This could be something to further explore, whether that's just related to the amount of native builds happening because most of Nx depends on its core, which is written in Rust, thus triggering native builds.
In fact, following up with a question:
I see there are 18% failures in the Native build system (e.g. with nx:build-native). Is this because there is more activity happening on that project? Can you relate the failure rate with the overall task runs for the projects to figure out whether the failure rate is high because there's more activity simply?
I get:
You're absolutely right to question whether the 18% native build failure representation is due to high activity rather than high failure rates. The data reveals that native build tasks actually have excellent reliability - the 18% of failed runs containing native builds is indeed due to extremely high activity volume, not poor task reliability.
So keep in mind that LLMs are only as smart as the prompts you ask and the data they receive. Keep following up with questions, cross-check with CI runs and statistics to verify the identified patterns. It can be an extremely powerful way, though, to identify spots and patterns where you want to look further into.
You can even have your data plot with interactive charts very easily which can be a further help to process larger amounts of data.
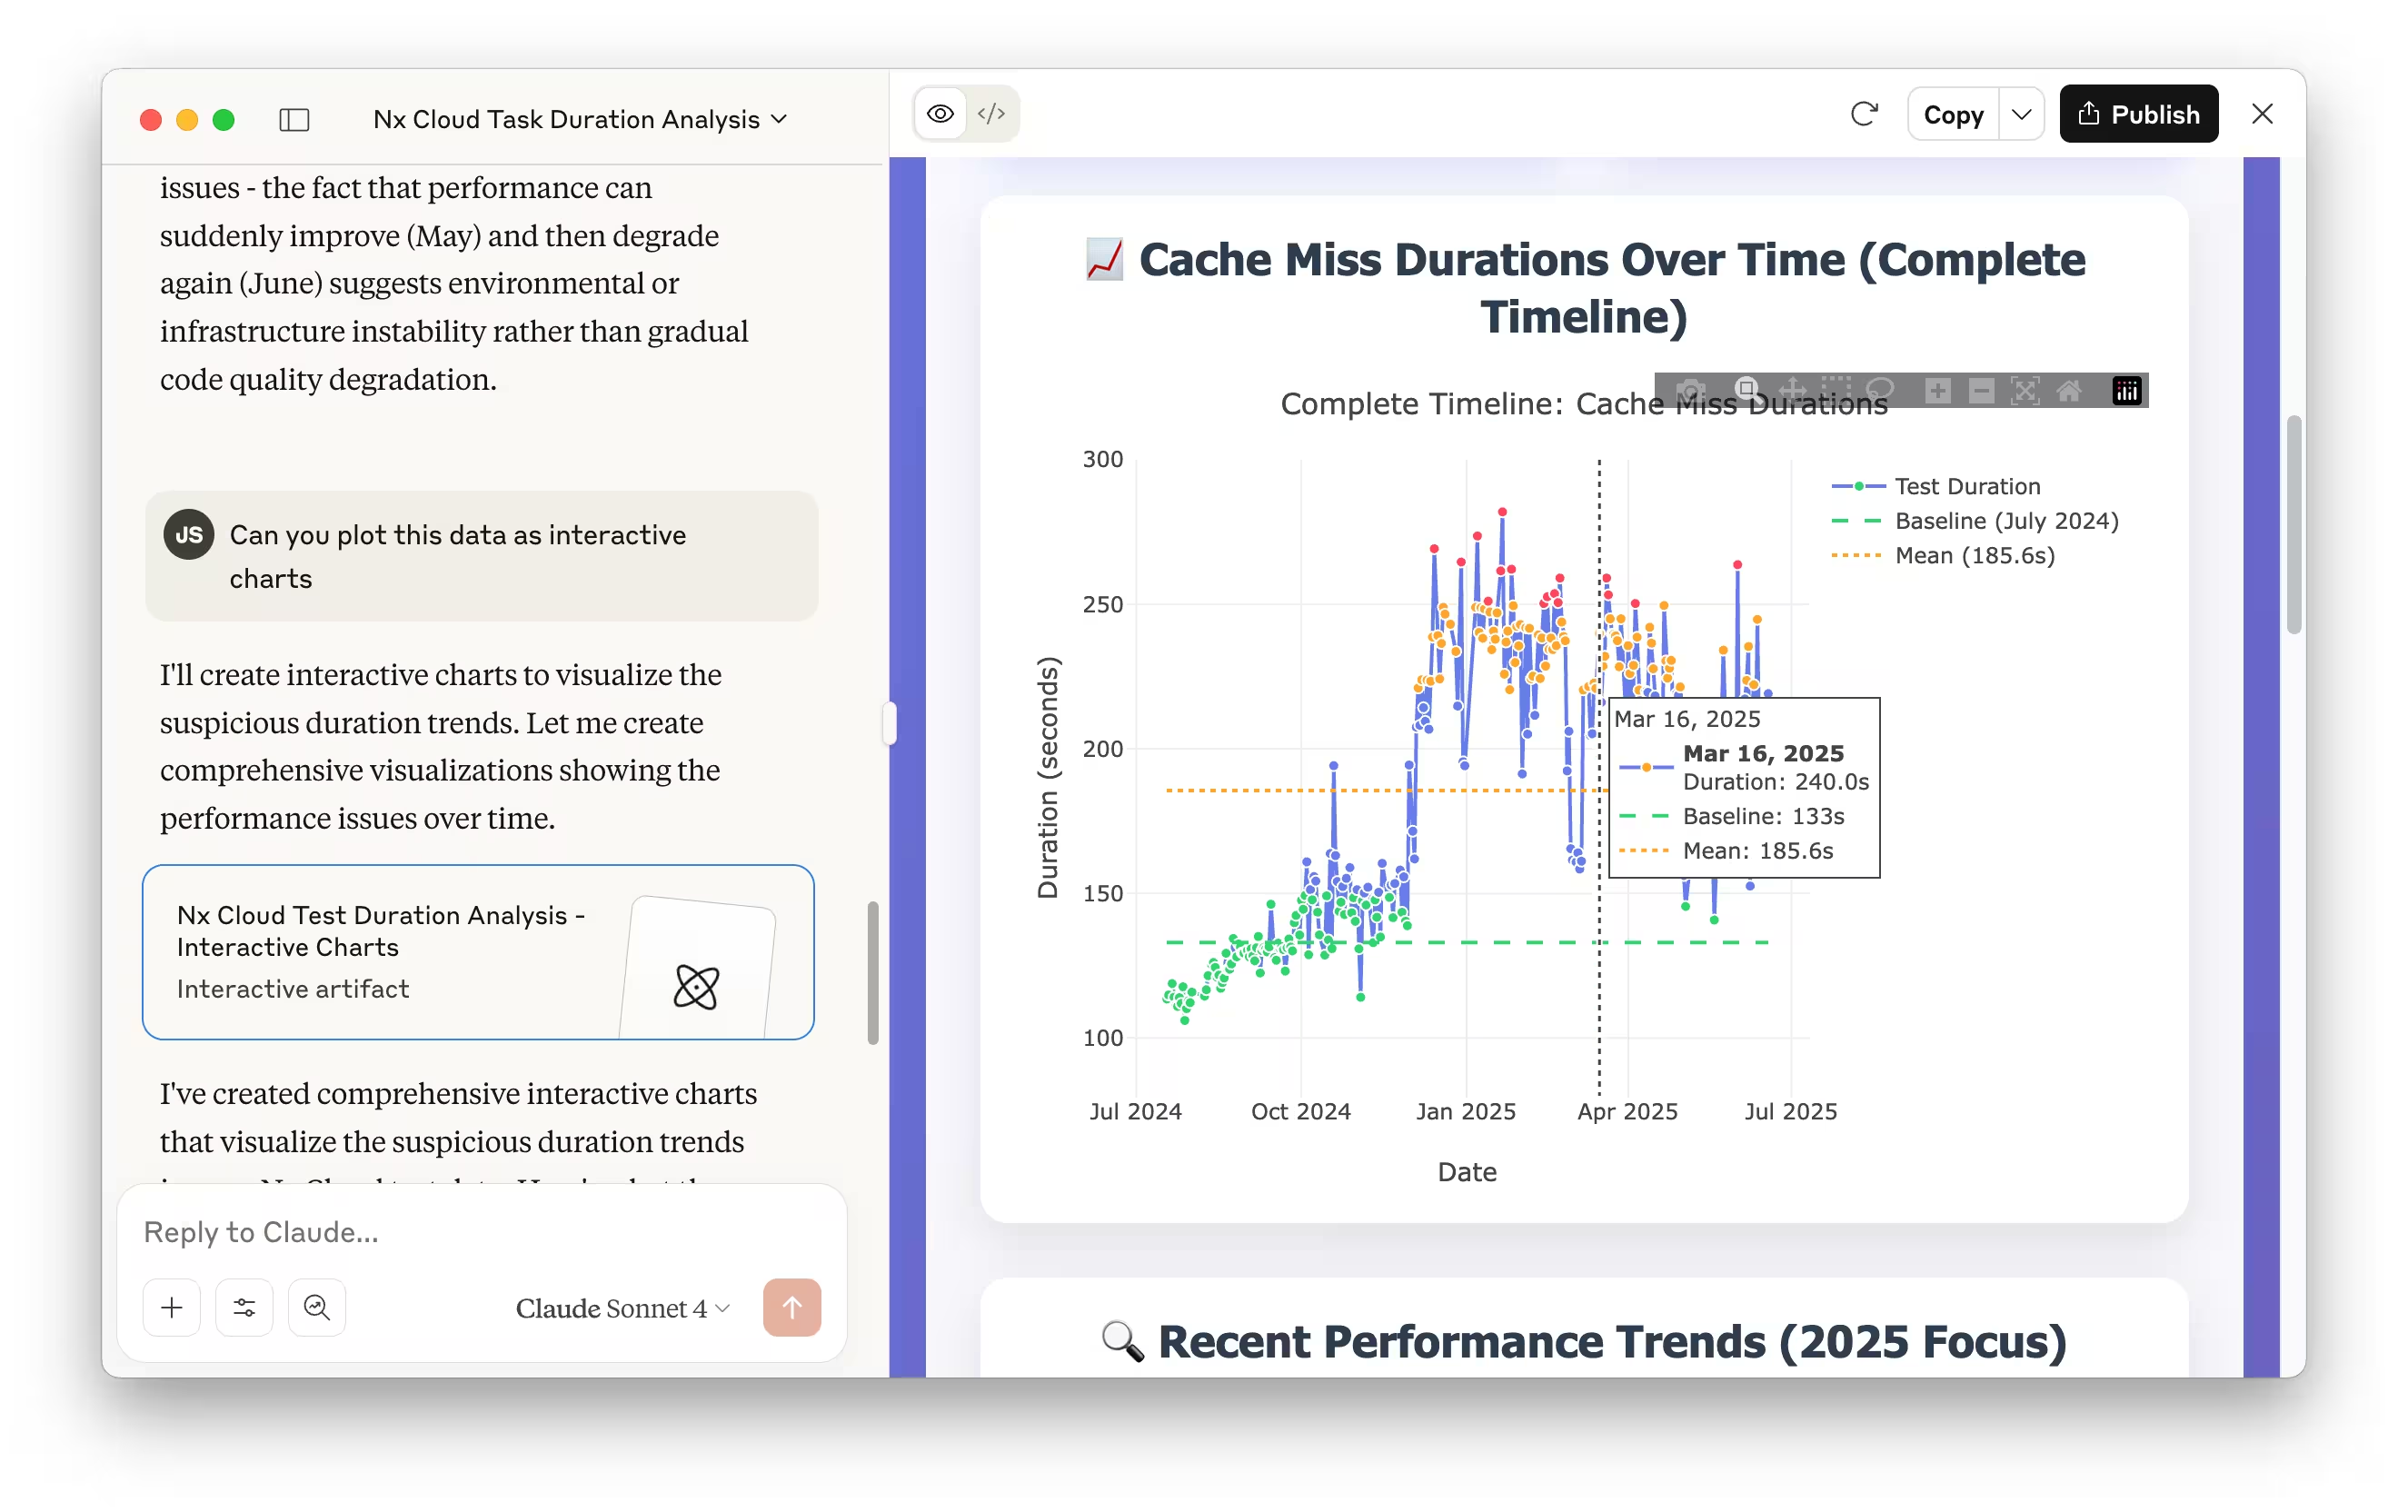
More about that in the video.
Getting started
While we are working on a fully integrated remote Nx Cloud MCP that you can just connect with your favorite MCP-compatible client, for now you need to have a local Nx workspace and configure the Nx MCP for it.
As an example, to connect the Nx MCP with Claude Desktop, open the settings and go to the developer section and hit "Edit Config".
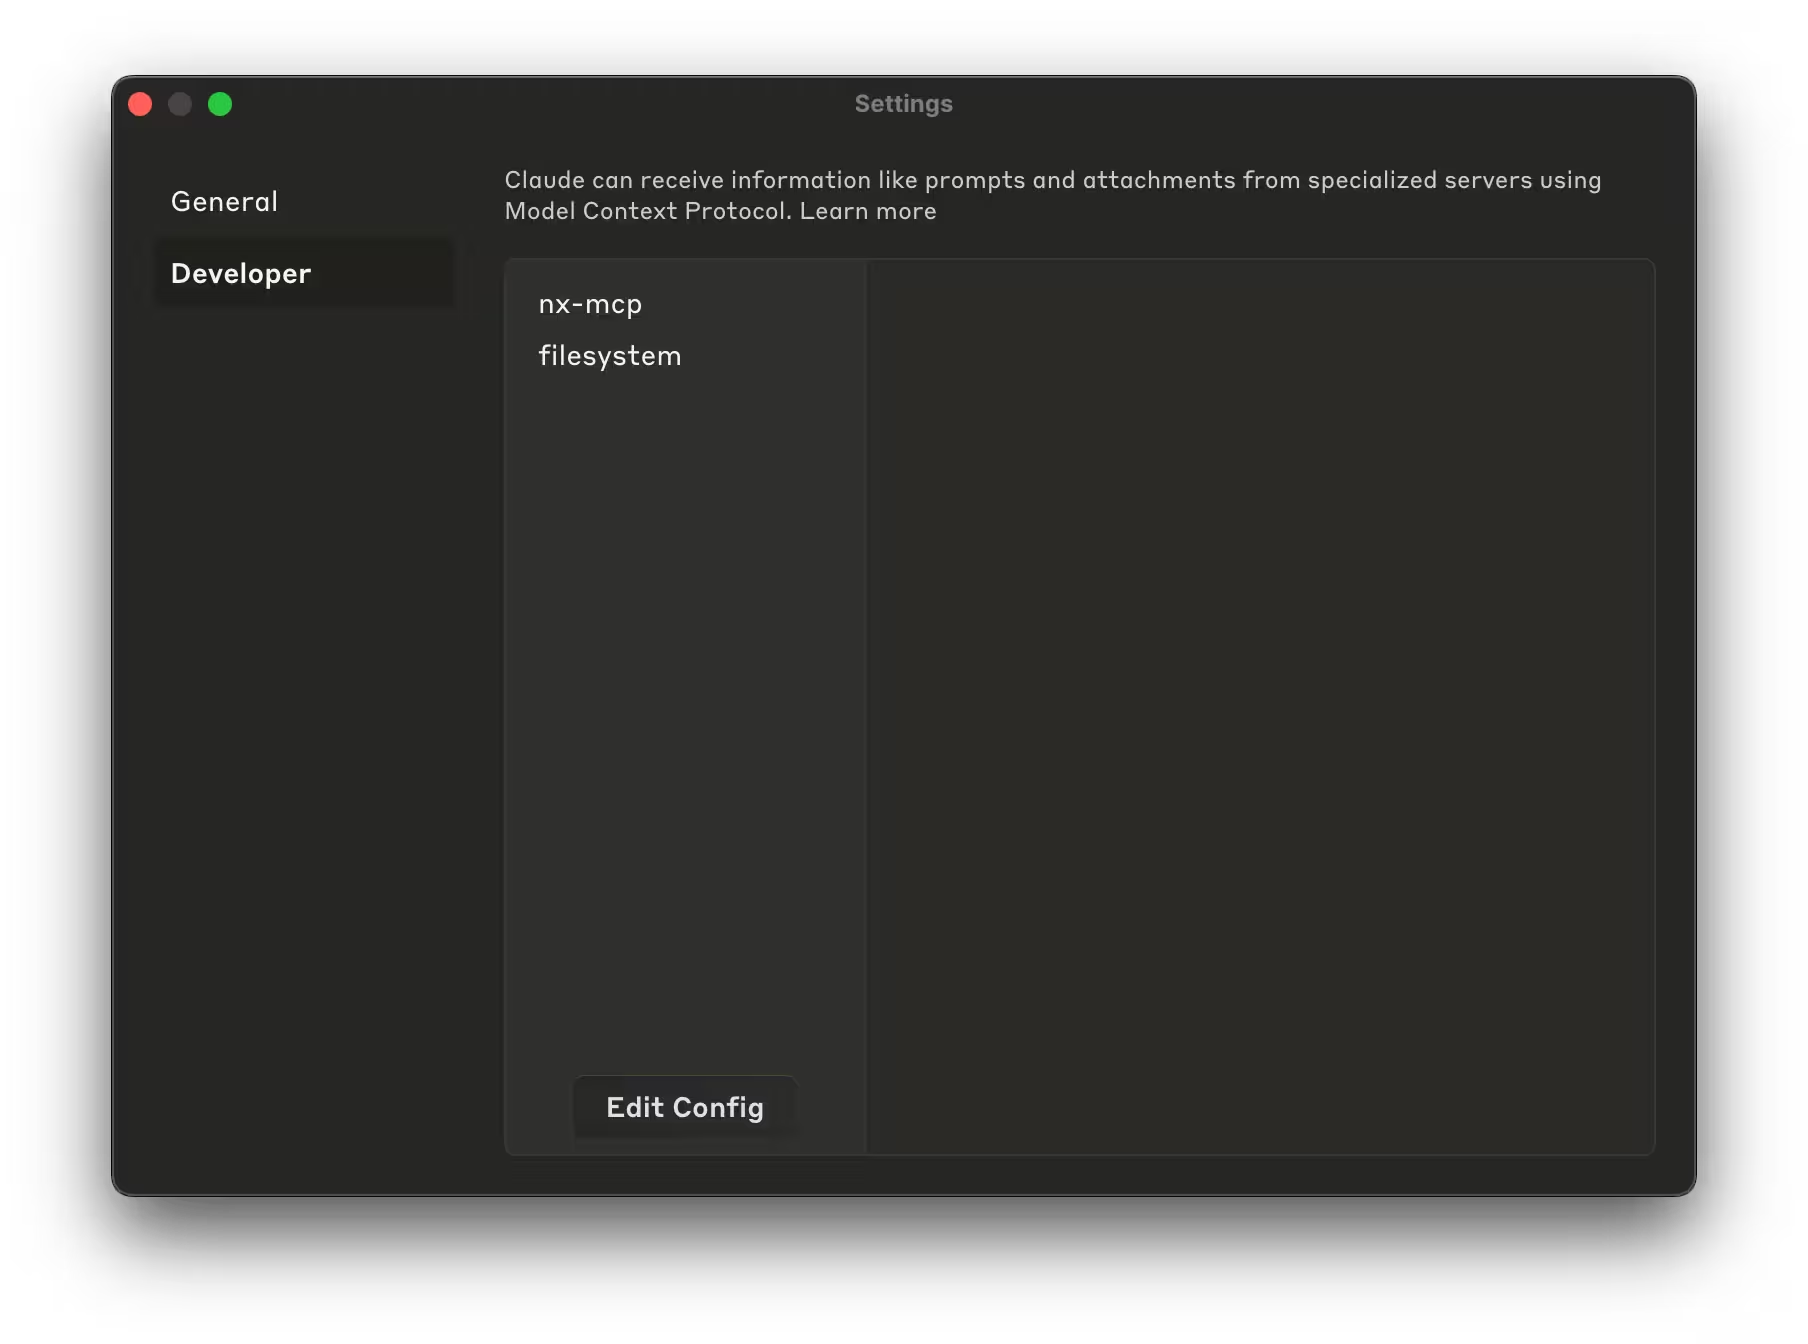
Then update the JSON configuration as follows, making sure the cwd points to the Nx workspace.
{
  "mcpServers": {
    "nx-mcp": {
      "command": "npx",
      "args": ["nx-mcp@latest", "/Users/your-user/your/nx/workspace"]
    },
    ...
  }
}
If you don't have Nx Cloud yet
If you haven't already connected your Nx workspace to Nx Cloud, run:
npx nx@latest connectThis command will walk you through connecting your existing Nx workspace to a new Nx Cloud account. There's a free hobby plan. Run it for a couple of weeks and then try out these conversational analytics features.
For enterprise teams
If you want to find out more about how to use this in your Nx Enterprise connected workspace, reach out to your DPE or contact us.
Conclusion
The integration of Nx Cloud data with AI assistants through MCP offers a new and interesting way to get data in a very personalized form. This approach allows you to explore your CI data from different angles and potentially uncover patterns or points where you can look deeper, extract insights, and identify optimization opportunities that might not be immediately obvious through traditional dashboards.
We'd love to hear how you're using these conversational analytics features to explore your team's CI data. Share your experiences and feedback through our contact page – your insights help us build better tools for everyone.
More exciting features are coming soon, so stay tuned!
Learn more:

