It’s the end of the sprint, and you’re staring at your PR, hoping that it turns green soon. You already had to re-run the CI pipeline because that one flaky test failed. Once again, you’re wondering why on earth the pipeline takes so long. Didn’t we just fix this last month? What happened?
The platform team is just as surprised. They know that CI is slow, but their priorities are already set. It’ll be another month before they can make time to fix this.
Introducing: Enterprise Task Analytics. Nx understands the length of your pipeline, and also the length of individual tasks and how reliable they are. With Task Analytics, Nx removes the guesswork around which tasks are actually making CI slower. The new Flaky Task Analytics will identify which flaky tasks cause more PRs to be re-run so you know how to prioritize fixes. We’re putting the data in front of you in easy-to-parse graphs and tables so you can diagnose the problem and get back to work.
The Visibility Gap in Modern CI
What You Can't See Will Slow You Down

When CI fails or slows down, you often don’t know why. The pipeline performance is a black box: you have an overall run time and you have logs. It’s not enough to really diagnose the problem. Sure, you know it took longer than usual, but why? When running multiple tasks on multiple projects in a pipeline, which task or project is the real culprit? You’re stuck digging through logs and comparing timestamps to figure out how long each task is taking.
Scaling up your workspace increases the complexity of diagnosis exponentially. More tasks, more logs, less visibility. Developer time is wasted doing this tedious investigation, and it turns into a game of whack-a-mole: next month, there’s just going to be another task that blows up. Your team is frustrated and the time you’re throwing at these problems cuts into time you’d rather be using on releases.
With AI assistants, we’re at a point in time where often you can produce more code than you get merged. As AI accelerates code generation, visibility into workspace health becomes critical. You can’t maintain velocity and quality at AI speed without knowing where your bottlenecks and reliability issues are. You need infrastructure intelligence for the AI era.
Task Analytics: Performance Diagnostics for Your Workspace
See Every Task's Performance at a Glance
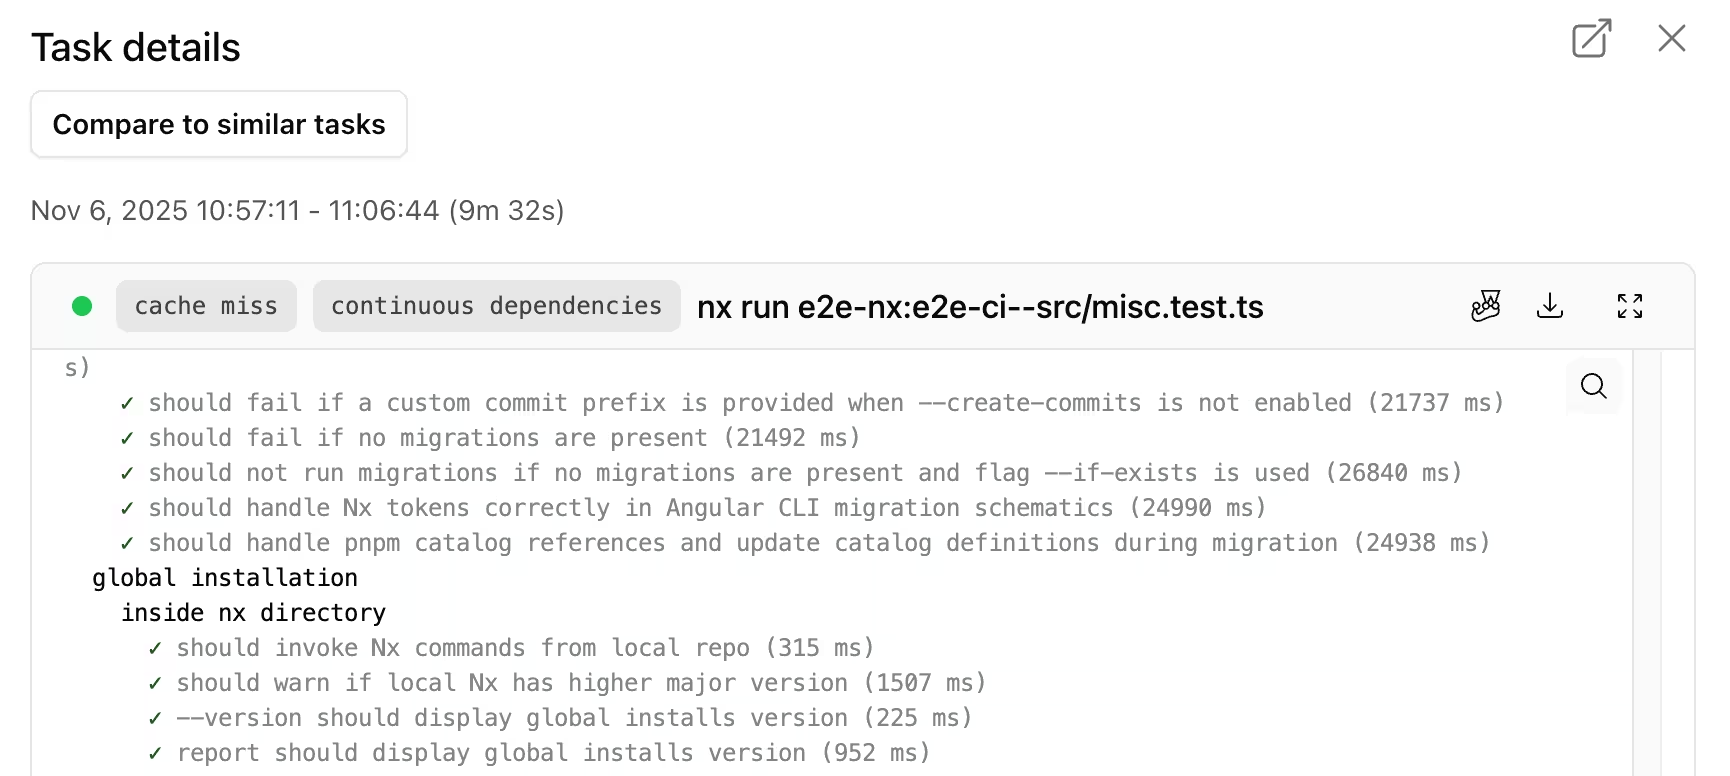
Nx already solves part of this problem by giving you structured logs and individual task durations. You can quickly look into a single CI run and see which task took the longest and immediately dive into the logs. Before now, you were limited to seeing task performance at this single pipeline view. Enterprise Task Analytics takes all of this data and levels it up to examine your entire workspace.
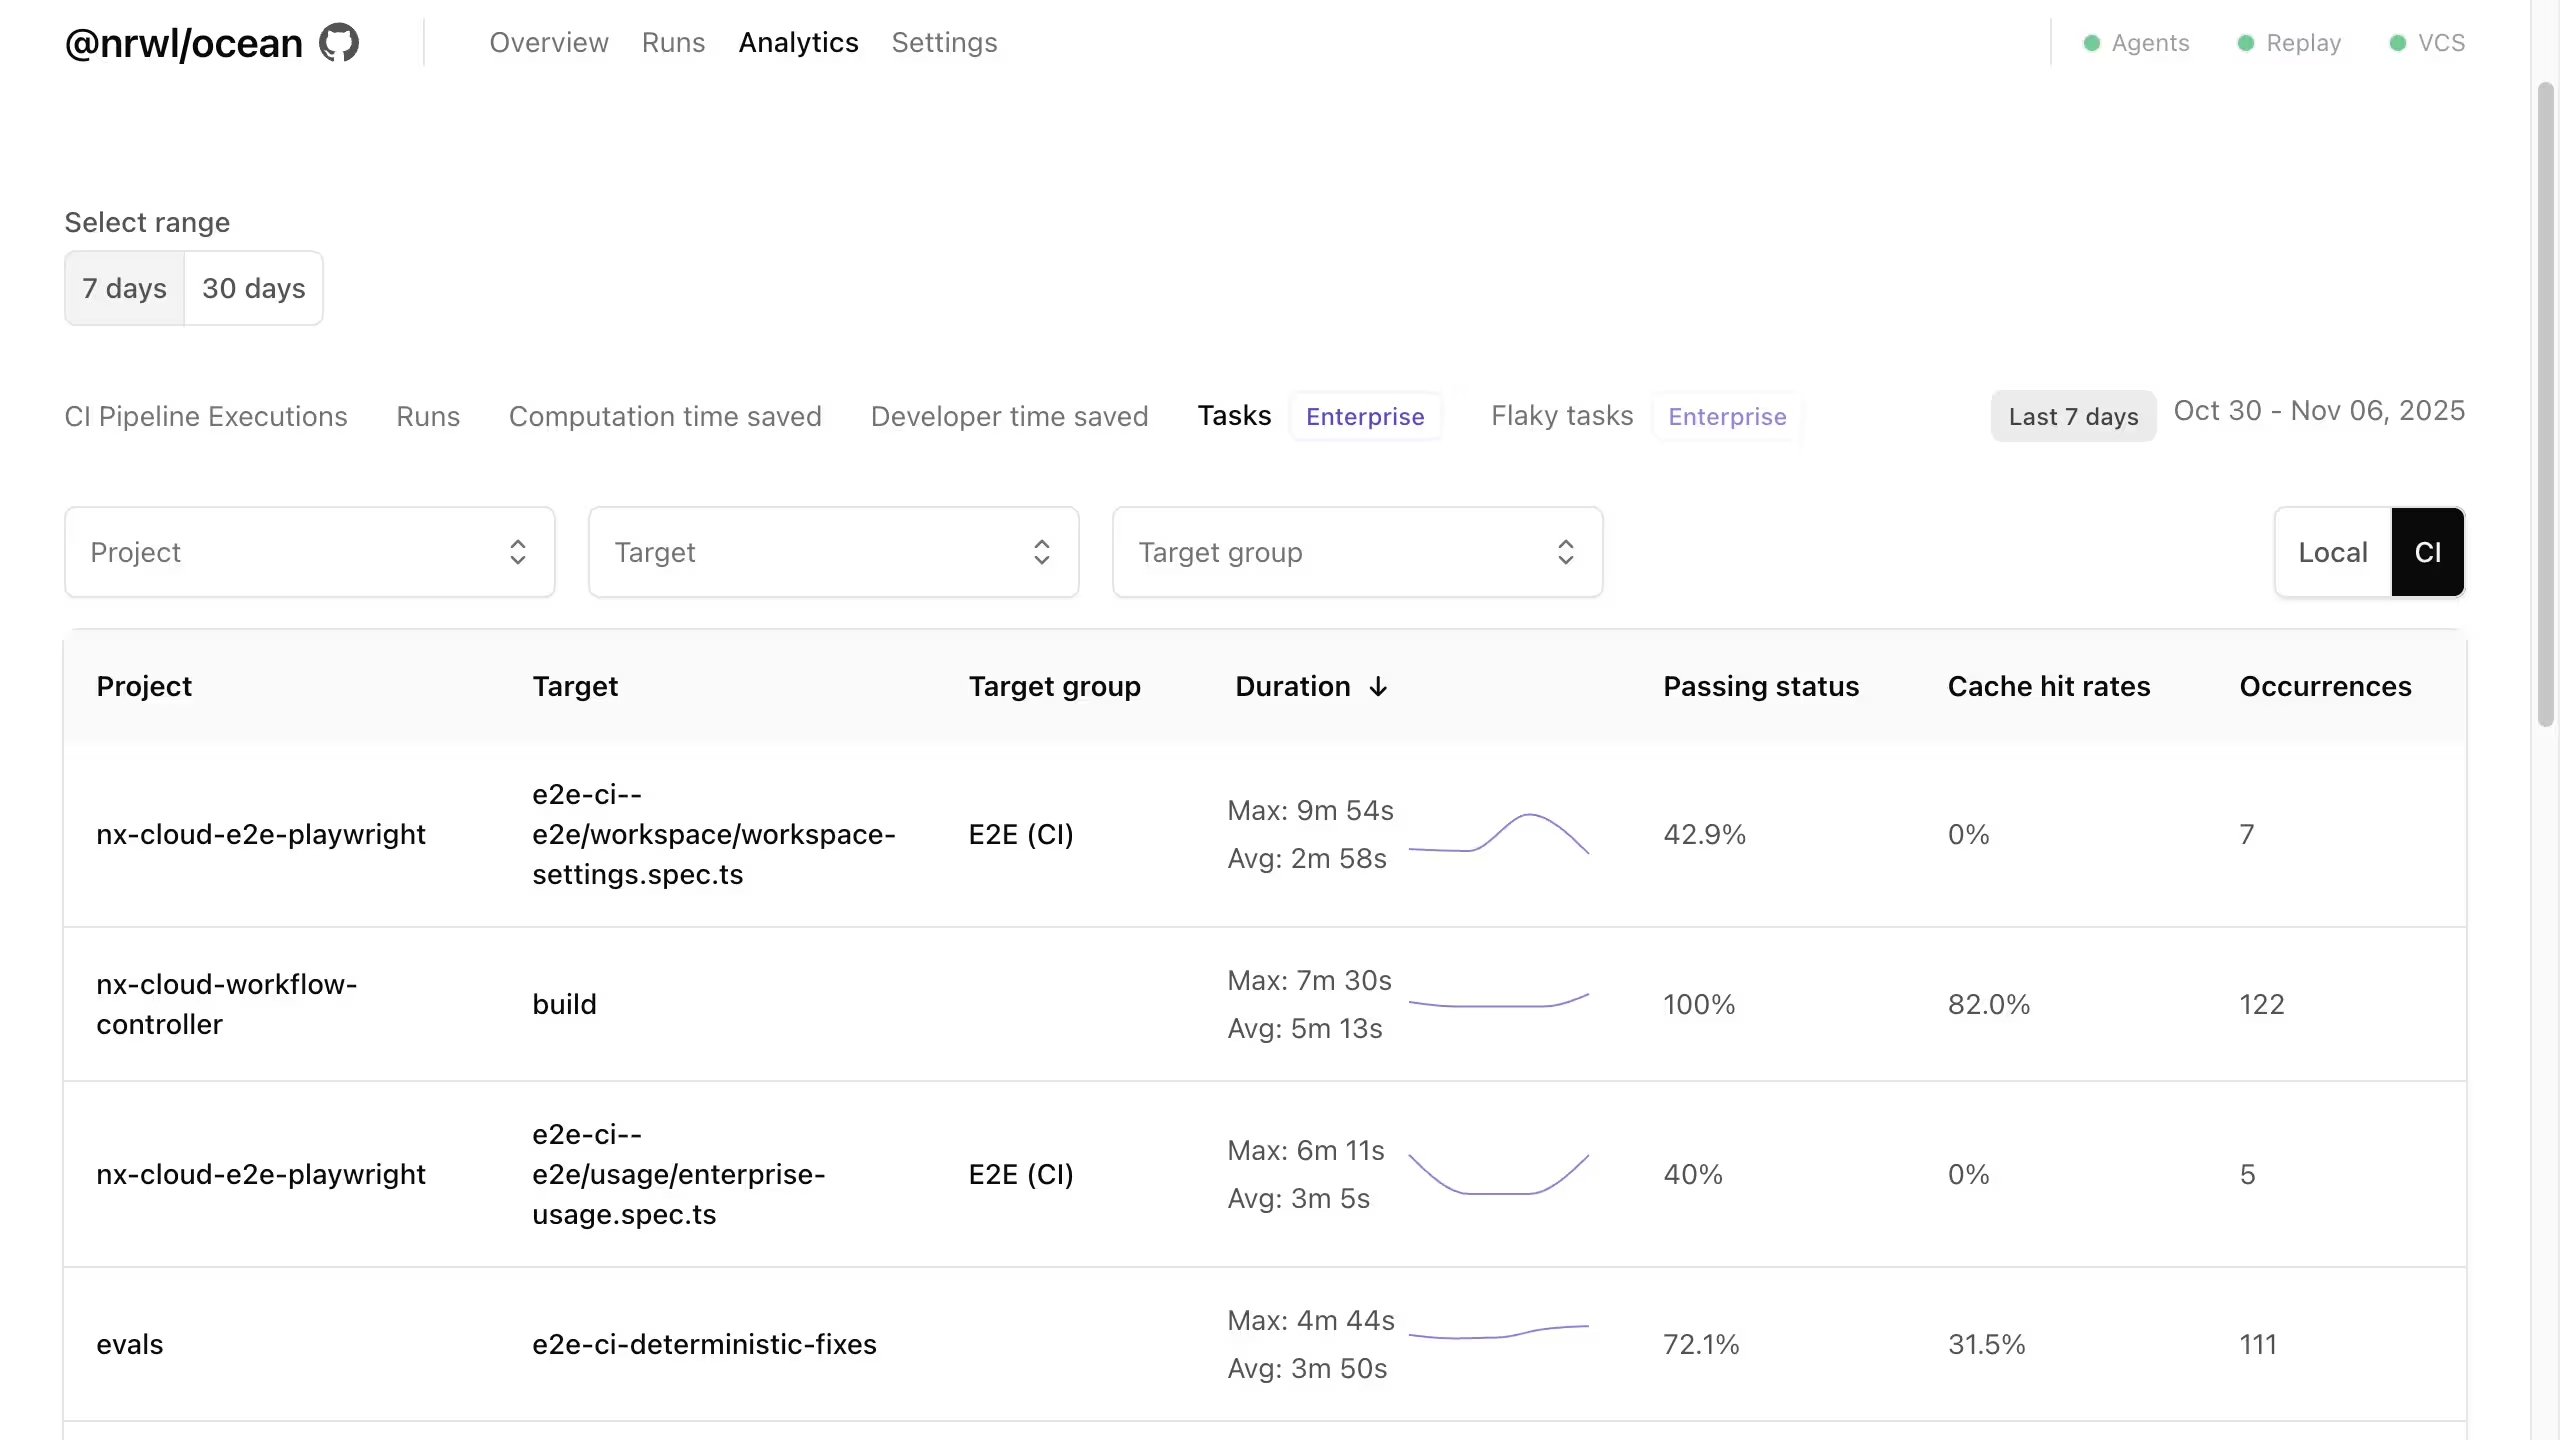
The Task Analytics dashboard shows you every task that ran within a selected time range, along with aggregate data like average and max duration, cache rate, and pass/fail percentages. Sort by these fields to reveal your worst offenders and filter the tasks further by project or target. A sparkline of average durations reveals recent trends in duration. You’ll be able to put a bullseye on what’s causing your long pipeline times in no time.
From Data to Action: Solving Real Problems
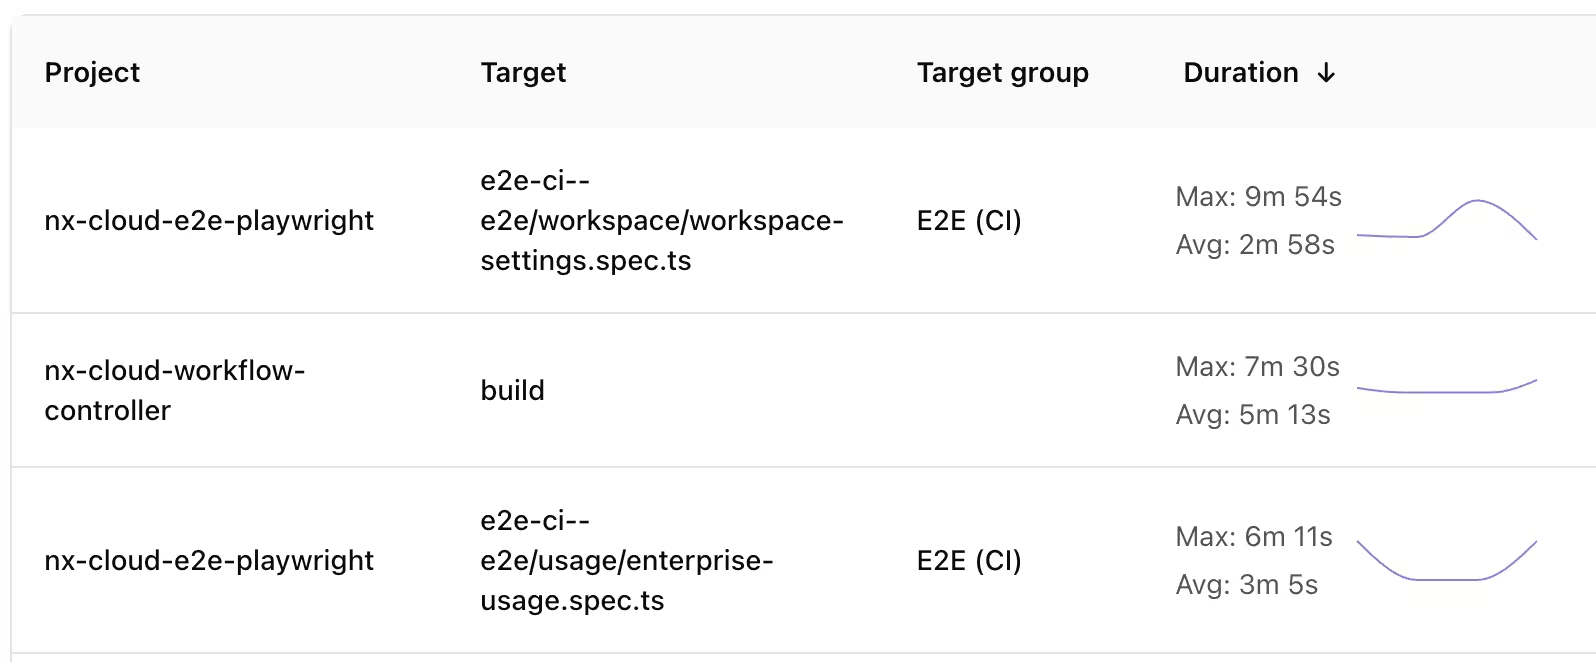
Let’s look at what problems you can solve with this new view into your data:
- Find performance regressions - By sorting the tasks by the max duration, you’ll see your longest running tasks. The sparkline for each one will show the trend of pipeline times for the time period. Spot the one with a spike in the sparkline, and you’ve found your regression.
- Identify refactoring candidates - By sorting tasks by the most occurrences, you’ll see your most often run tasks. If these tasks are taking a long time to run, they’re likely too large or tightly coupled to other parts of your architecture. Time to refactor this package so it’s able to either run faster or run less often.
- Improve caching strategy - By sorting the tasks by the lowest cache rate, you’ll see tasks that are rarely read from the cache. Why is that? Look into the caching configuration like inputs for that task.
Flaky Task Analytics: Stop Wasting Time on Unreliable Tasks
The True Cost of Flakiness
Flaky tasks aren’t just annoying, they waste CI time and developer focus. Every time you re-run a pipeline due to a flaky task failing, you’re wasting compute on running tasks again, and the dev is pulled out of real work to make sure the PR passes this time.
Nx already mitigates this with our automated flaky task retries. Individual tasks can be re-run rather than the entire pipeline. Less compute time is wasted, and the dev can stay focused. This can reduce the impact of flaky tasks, but ultimately you still want to fix these tasks so they’re no longer flaky. After all, even with the automatic re-tries, you’re still wasting compute re-running these flaky tasks. But how do you determine which flaky tasks are most important to fix?
Prioritize Fixes by Impact, Not Noise
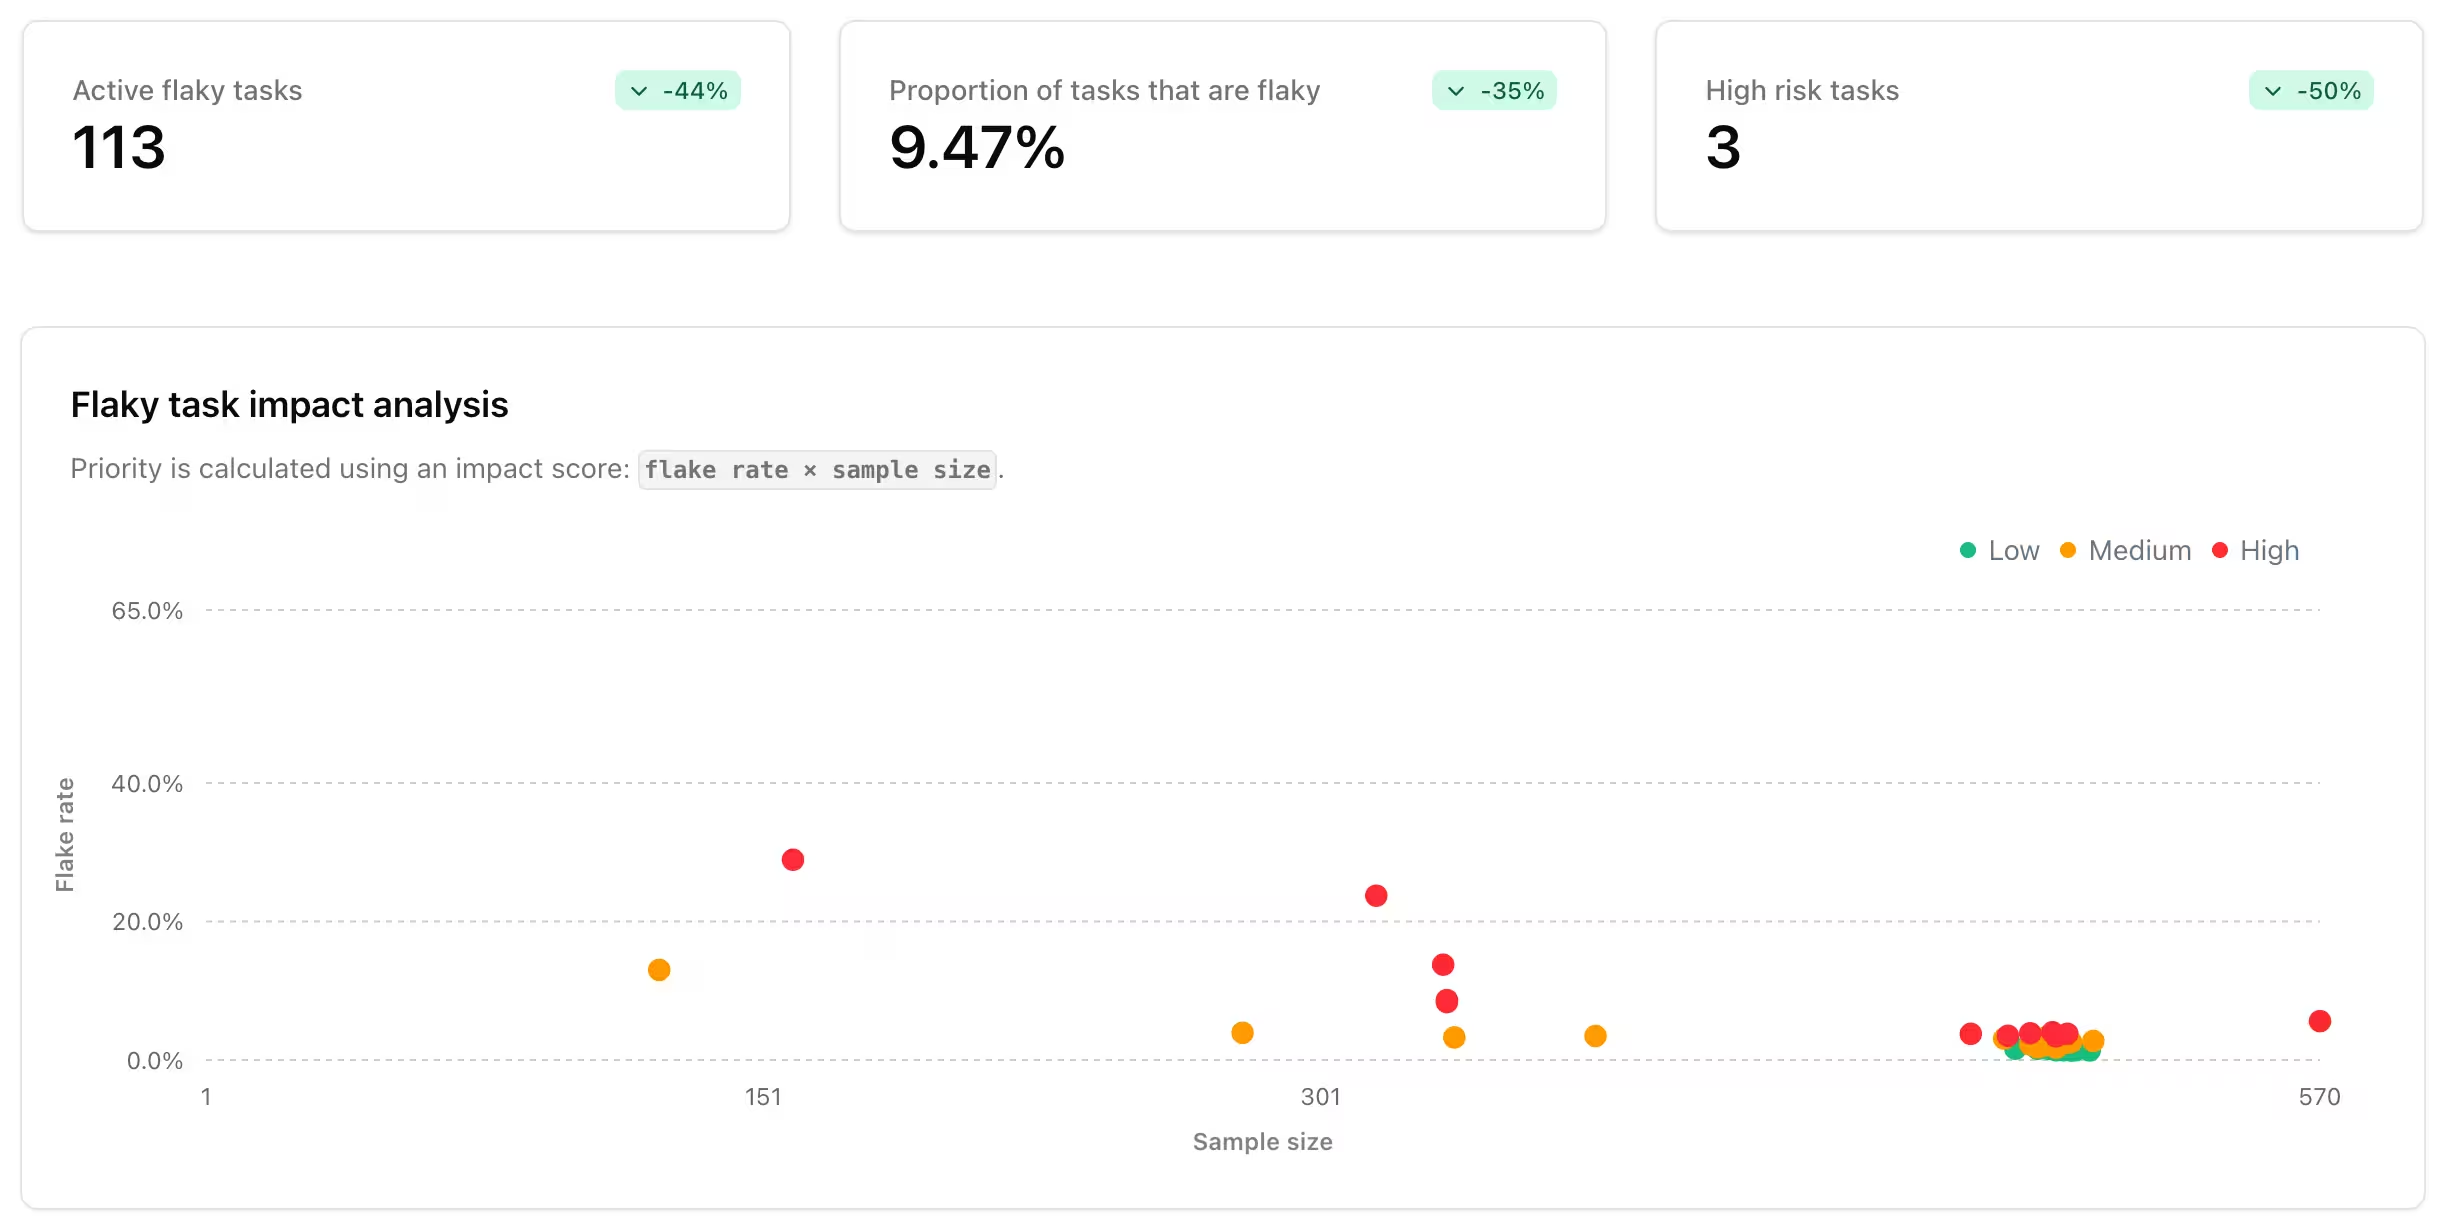
Enter the new Flaky Tasks Analytics dashboard. Here, you’ll see a quick stats panel that shows you how many flaky tasks you have, what percentage of your total tasks they make up, and how many tasks are considered “high risk.” High risk tasks are any tasks that have a flake rate higher than 20%. Each of these stats will also show the trend compared to the last time period, so you know how things are changing over time.
Below that, the scatter chart shows tasks based on the number of times they ran and how often they failed and had to be re-run. Tasks are color‑coded by the impact of their flakiness.
Finally, a data table shows you all of your flaky tasks, along with stats like flake rate, time wasted, and the last time this task ran. Selecting a task allows you to dig deeper, and even view logs from recent runs.
Real-World Flaky Task Scenarios
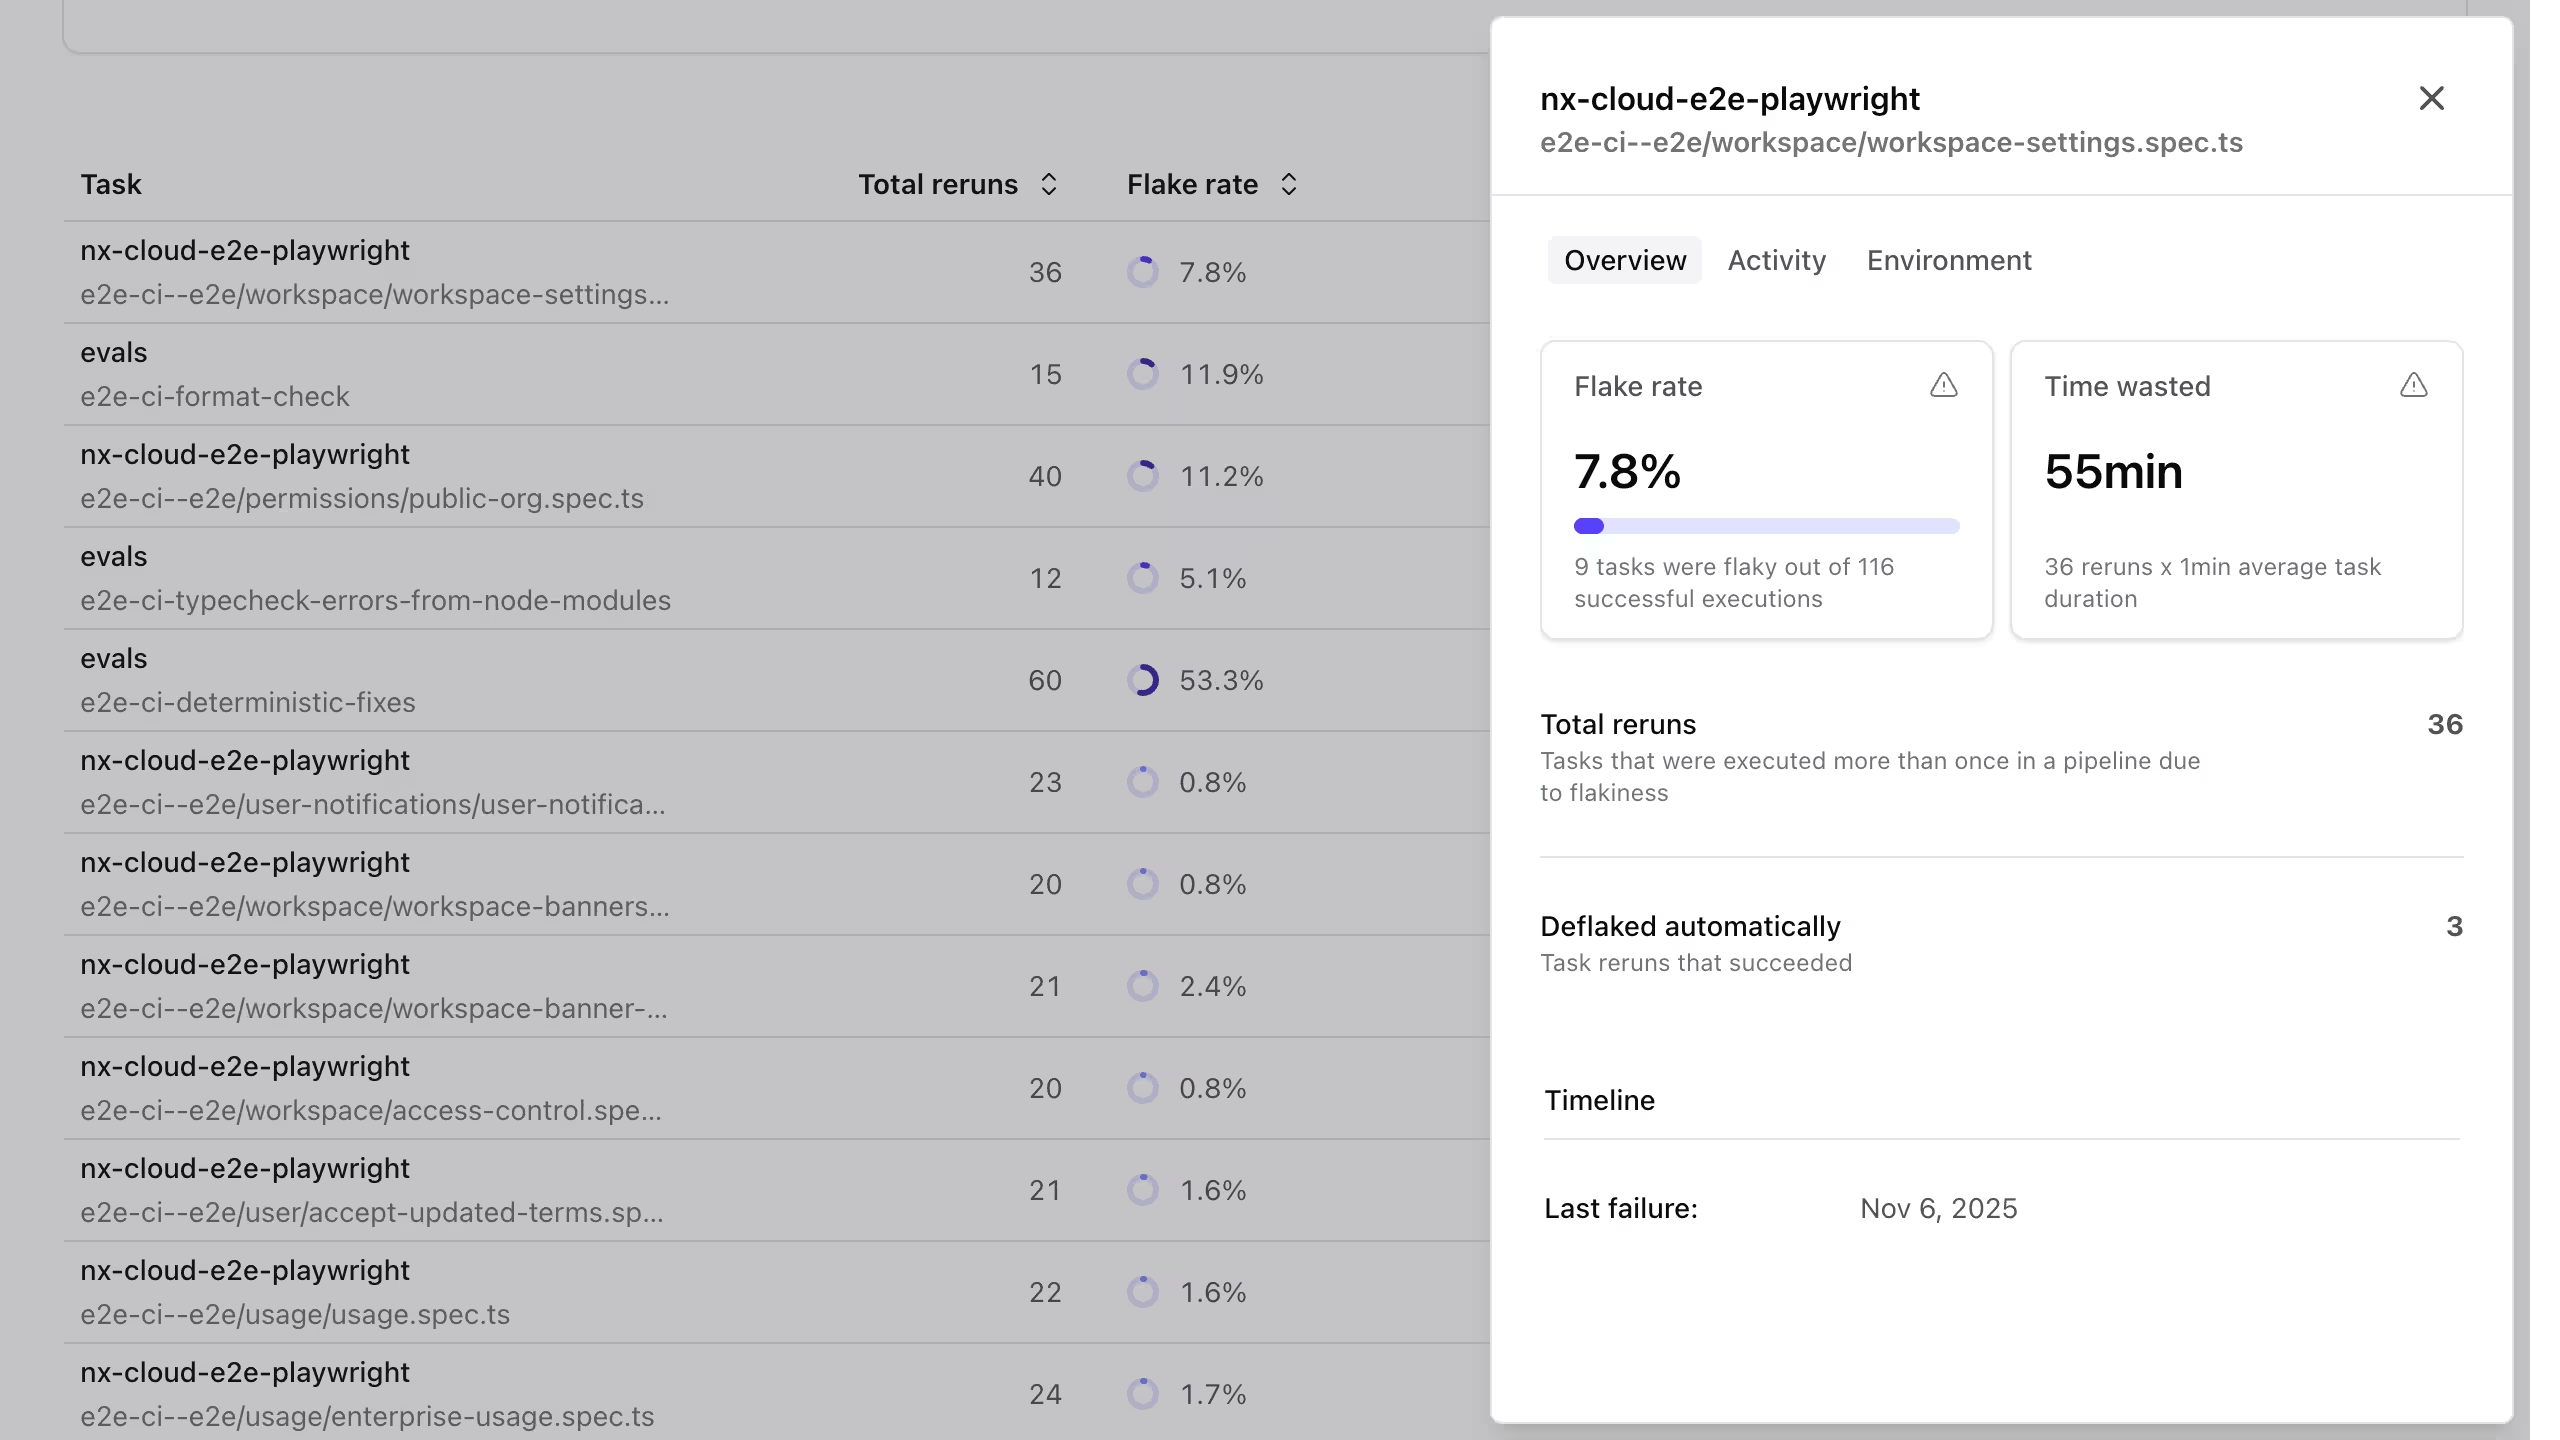
Let’s look at what problems you solve with this data:
- Team effort planning - Look at the chart for the tasks color-coded red, which are the highest impact. These tasks have either a high flake rate or are run very often. Even worse, they might be both! Plan to eliminate these flaky tasks for the highest impact to your CI times.
- Debugging unreliable CI - Once you’ve chosen a particular task to investigate, you’ll be able to jump-start your investigation by going directly to the needed logs instead of hunting them down in the massive logs generated by other CI providers.
- Tracking reliability improvements over time - After running a week of flaky task elimination, check the dashboard for the comparison to last week’s stats.
From Reactive to Proactive
All of this data takes your team from being reactive to being proactive. Rather than responding to problems once they impact developers, you can monitor task time and flakiness. You can eliminate that voice in the back of your head that says, “These build times feel longer than they were before,” because you have the data to know if these build times are longer.
When the data is right in front of you, you make data-driven decisions rather than guessing at what’s increasing times. Choose which tasks have the most impact so that you can prioritize time to get them fixed before they get out of hand.
Available Now for Nx Enterprise Customers
Enterprise Task Analytics is available today for all of our Nx Enterprise customers on our multi-tenant instance with no setup required. Head to the Analytics section in one of your workspaces, and you’ll see two new tabs: Tasks and Flaky Tasks.
Nx Enterprise enables large organizations to ship quickly without compromising quality, at scale. In addition to Task Analytics, you’ll also get insight into your organization with Polygraph tools like:
- Workspace graph - See dependencies across every repo in your organization, whether they use Nx or not.
- Conformance - Bring automated consistency and maintainability to your entire organization—regardless of what technology stack you're using.
What's Next
These views are really exciting on their own, but we’ve got more coming. Here’s what you can look forward to:
- Anomaly detection - Automated warnings of changes in trends. Nx will actively monitor your workspace health, flagging performance bottlenecks and reliability issues.
- Cross-repo analytics - While analytics track tasks across individual workspaces now, we’ll be expanding this to report on repos across your entire organization. This means visibility across your entire organization’s CI performance, giving you the insight of a monorepo across all of your repos.


