

The resource usage add-on records CPU and memory metrics while your tasks run and surfaces them in Nx Cloud. Use this data to find resource bottlenecks, debug out-of-memory (OOM) errors, and pick the right agent size for your workload, all the way down to which task caused a spike.
Enabling resource usage
Section titled “Enabling resource usage”Enable the add-on under Settings > Add-ons, or from the Enable resource profiling prompt on the Analysis tab of any CI pipeline execution.
Once the add-on is active, metrics are collected and uploaded automatically, whether you distribute your tasks with Nx Agents or run them on a single machine. There's nothing else to configure.
When a CI pipeline execution doesn't yet have the add-on, Nx Cloud shows a preview with sample data and a prompt to enable it, including a note on the Self-healing CI PR comment when a run hits memory or CPU issues.
Viewing resource usage
Section titled “Viewing resource usage”Runs with Nx Agents
Section titled “Runs with Nx Agents”Open any CI pipeline execution and go to the Analysis tab.
Agent resource usage summary
Section titled “Agent resource usage summary”The Agent resource usage table lists every agent in the run with its average and maximum CPU and memory, plus the machine specs (cores and RAM) of its resource class. It's the fastest way to spot an agent that ran hot.

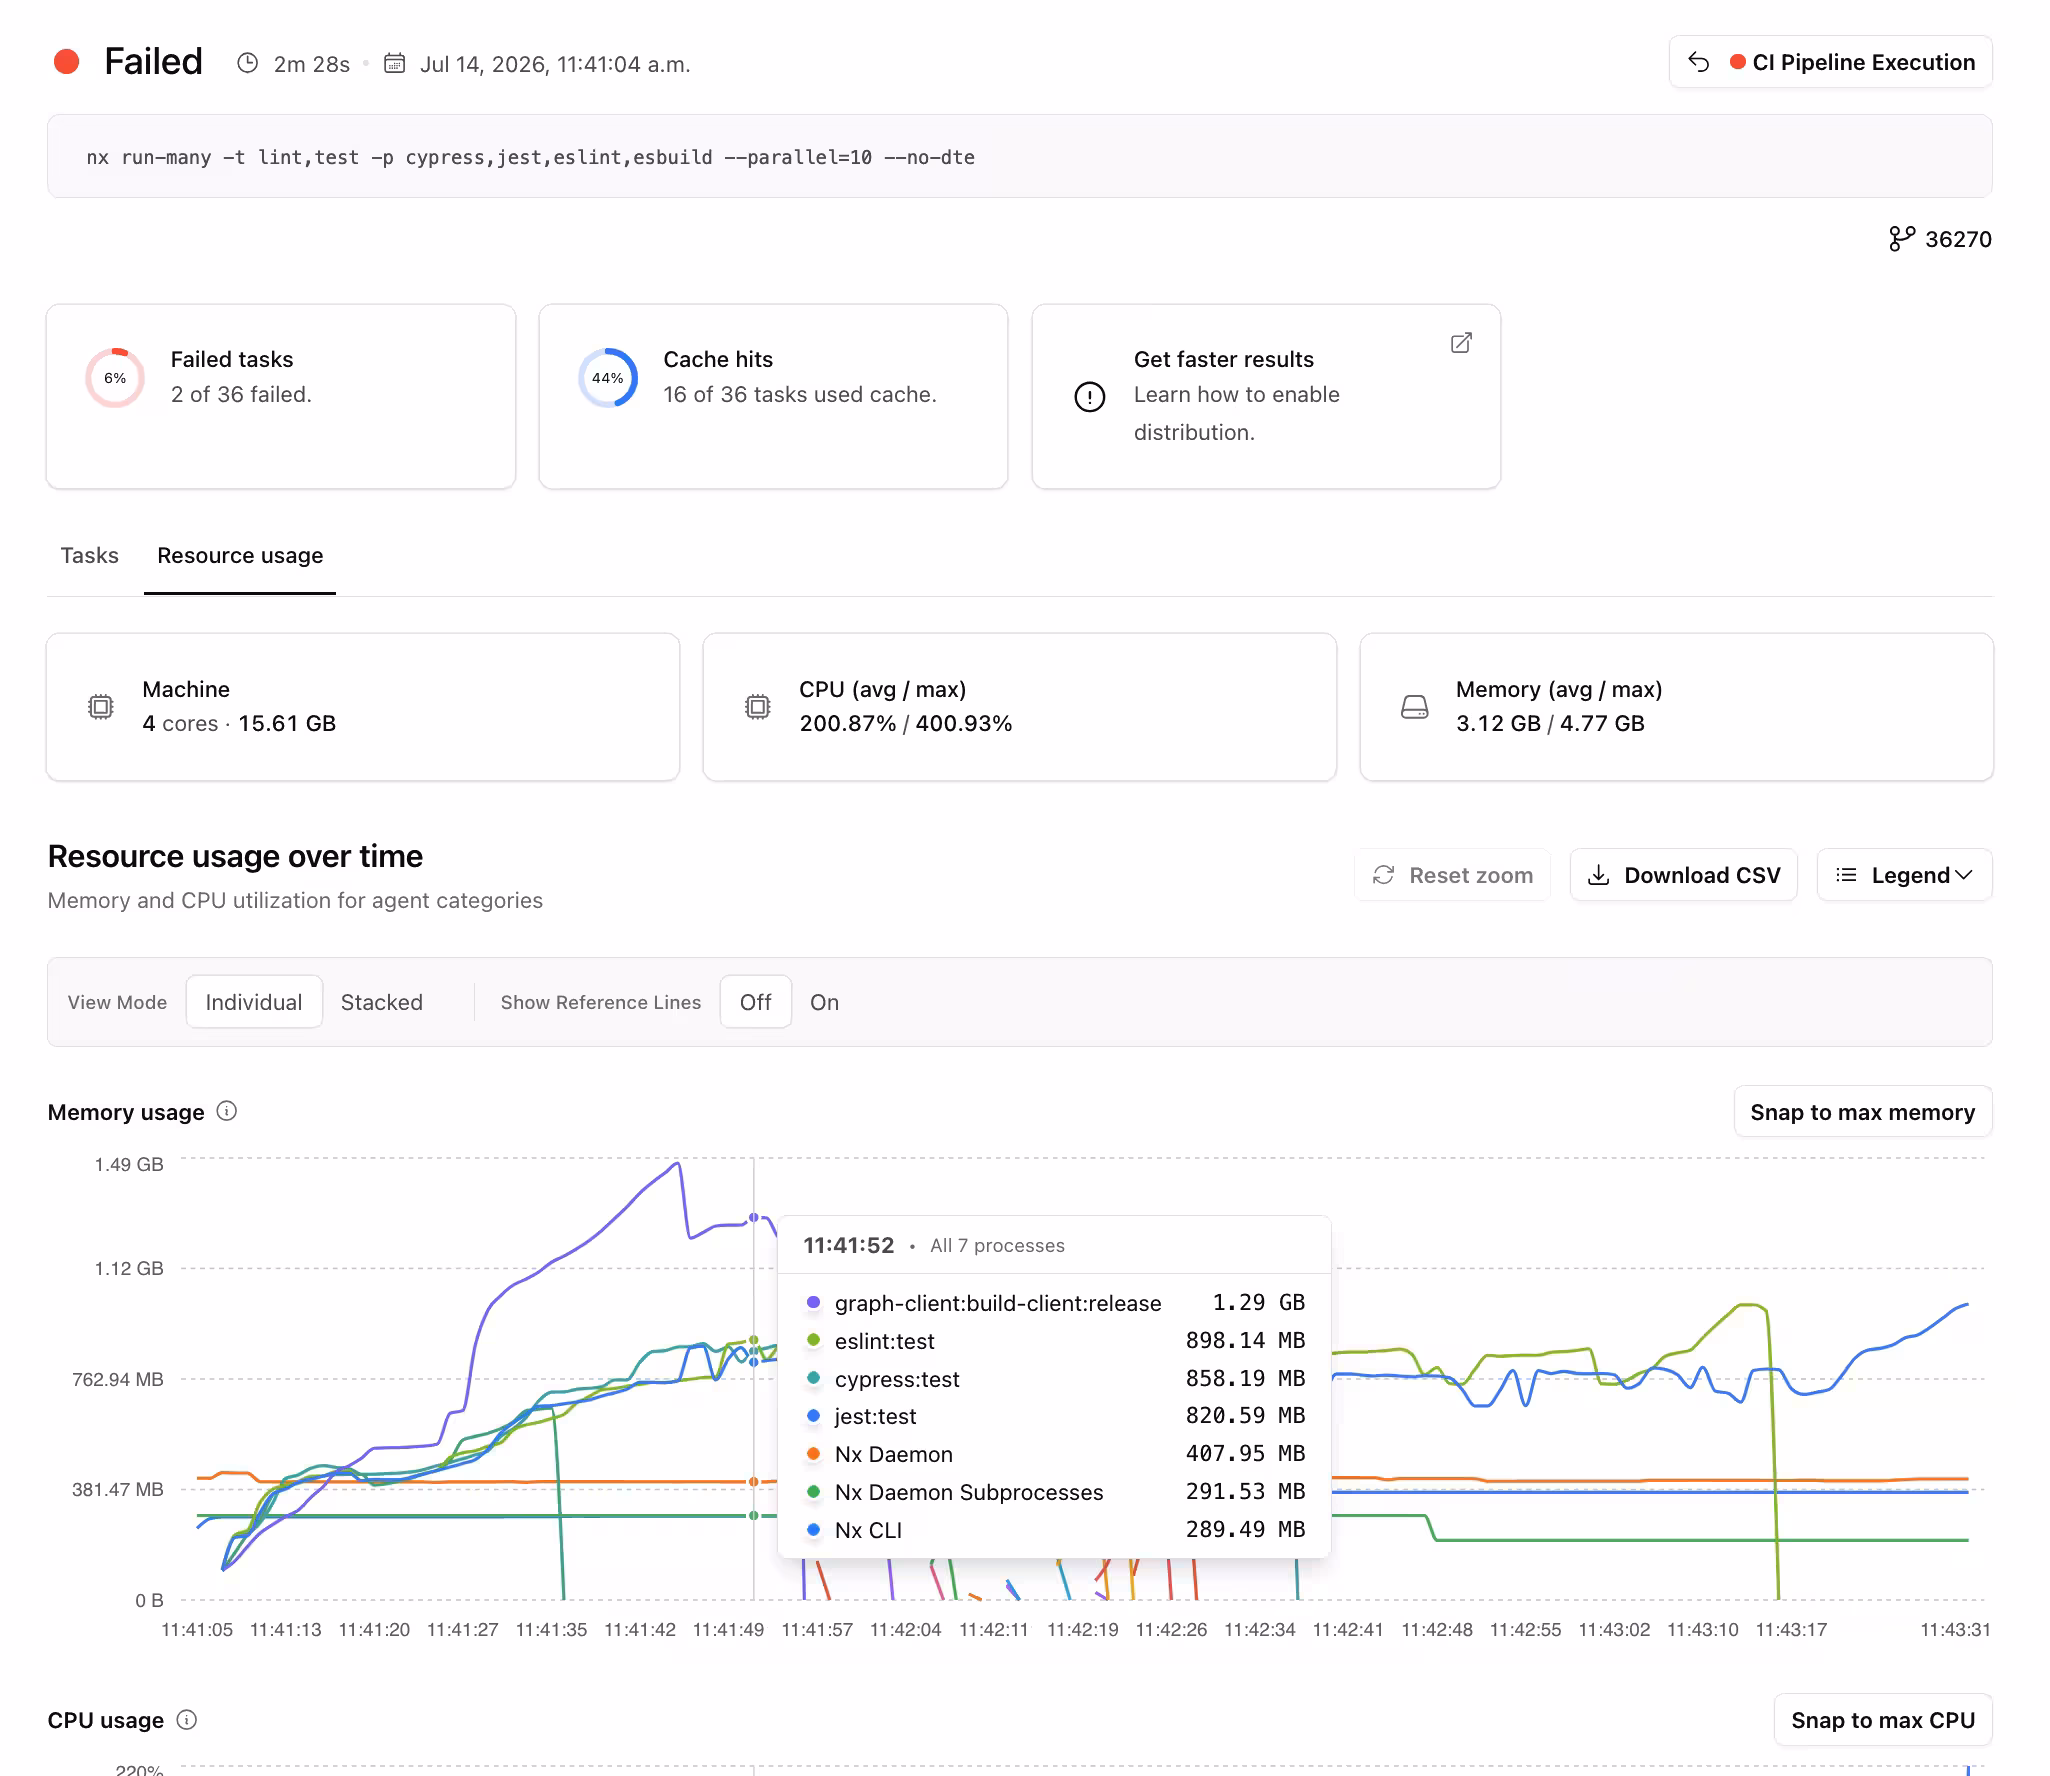
Resource usage over time
Section titled “Resource usage over time”Click an agent to open its Resource usage over time view. Separate memory and CPU charts plot utilization across the agent's lifetime, with reference lines for the machine's capacity and peak usage. When a task exceeds available memory and is killed, the chart marks the out-of-memory point so you can trace the failure back to the task that caused it.

The detail view has a few controls for digging in:
View mode - switch between Individual (each task or process plotted separately) and Stacked (total usage at any point in time).

Reference lines - toggle the capacity and peak-usage lines on or off.
Snap to max - zoom the axis to the peak memory or CPU value.
Legend - click items to focus on specific tasks or processes (for example a single
nx build, the Nx daemon, or CLI overhead).
Timeline scrubber - jump to a point in time or zoom in on a spike.

Download CSV - export the raw per-process data for deeper analysis.
Runs without Nx Agents
Section titled “Runs without Nx Agents”For a run that isn't distributed on Nx Agents, open the run details and go to the Resource usage tab.
Common use cases
Section titled “Common use cases”- Find memory-hungry tasks - figure out which project eats the most memory when running in parallel, then lower its parallelism instead of slowing everything down.
- Debug OOM kills - trace an out-of-memory failure to the exact task that caused it.
- Spot misconfigured tooling - catch a bundler or build tool pulling in more files than it should.
- Right-size agents - pick the correct agent resource class when moving to Nx Agents from GitHub Actions or another CI provider.
- Detect memory leaks - look for tasks where memory keeps climbing over time.
- Compare before and after upgrades - check whether a dependency upgrade spiked resource usage.
Resource metrics when you bring your own compute
Section titled “Resource metrics when you bring your own compute”If you run the agents on your own CI compute, Nx Cloud can still collect per-agent CPU and memory metrics. Opt in by adding a single CLI step to each agent job.
What to add
Section titled “What to add”At the end of each agent job, run npx nx-cloud upload-agent-metrics. Use your provider's always-run mechanism so the step runs even when the agent is killed mid-task, which is precisely the scenario where the metrics matter most.
Here's the GitHub Actions step:
- name: Upload agent metrics if: always() run: npx nx-cloud upload-agent-metrics env: NX_AGENT_NAME: ${{ matrix.agent }}The if: always() condition is important: if an agent is OOM-killed mid-run, the normal step sequence stops, but the upload still needs to happen so you can see which task caused the kill.
The bring your own compute guide shows the equivalent step for CircleCI, Azure Pipelines, Bitbucket Pipelines, GitLab CI, and Jenkins.
Configuration
Section titled “Configuration”Metric collection is controlled by these environment variables:
| Variable | Description |
|---|---|
NX_CLOUD_DISABLE_METRICS_COLLECTION | Set to true to disable CPU and memory metric collection during task execution. |
NX_CLOUD_METRICS_DIRECTORY | Directory where Nx writes resource metrics during task execution. |